Generate the Summary Statistics for the Federal Reserve Data
Now that you have access to the input data source, you
can start your analysis.
-
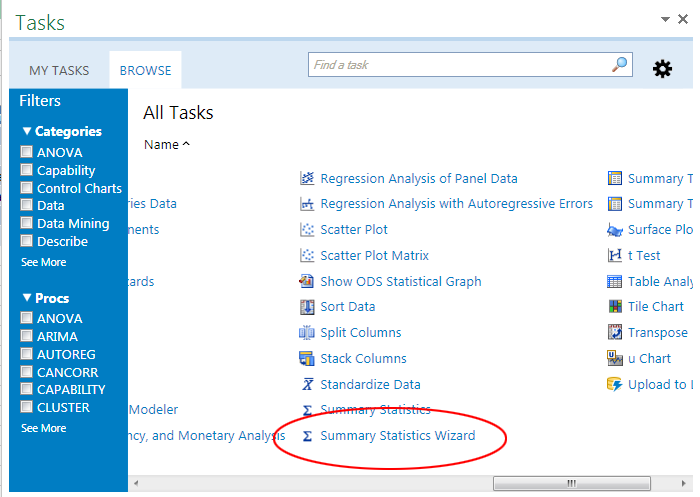
On the SAS tab, click Tasks. The Tasks window appears.TipThis task interface could appear as a pane in your Microsoft Office application. The functionality in the pane and the window is identical. This book assumes that you are using the Tasks window.
-
In the Tasks window, click Browse, and then select Summary Statistics Wizard. The Choose Data dialog box appears.TipOn the Browse tab in the Tasks window, the tasks are listed alphabetically. However, you can search for tasks by keyword, or you can filter the list of tasks by type, category, or SAS procedure. The Summary Statistics Wizard is in the Describe category.
-
For the input data, select Excel Data and specify the range of the Excel data in the Original Data worksheet.TipIf your input data source is selected in Excel, then the SAS add-in automatically lists this range in the Excel Data box.
-
For the location of the results, select New worksheet. Change the name of this worksheet to
Summary Statistics.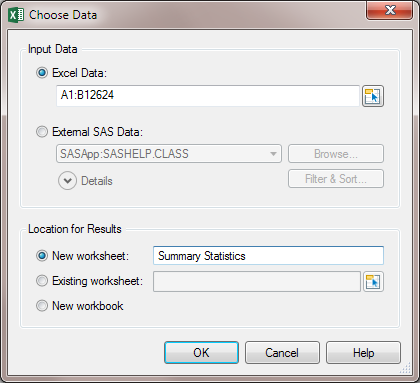 Click OK. The Summary Statistics Wizard appears.
 -
In step 1 of the wizard, verify that you have selected the data source that you want to use. Click Next.
-
In step 2 of the wizard, assign the VALUE variable to the Summary statistics of (Analysis variable) role.
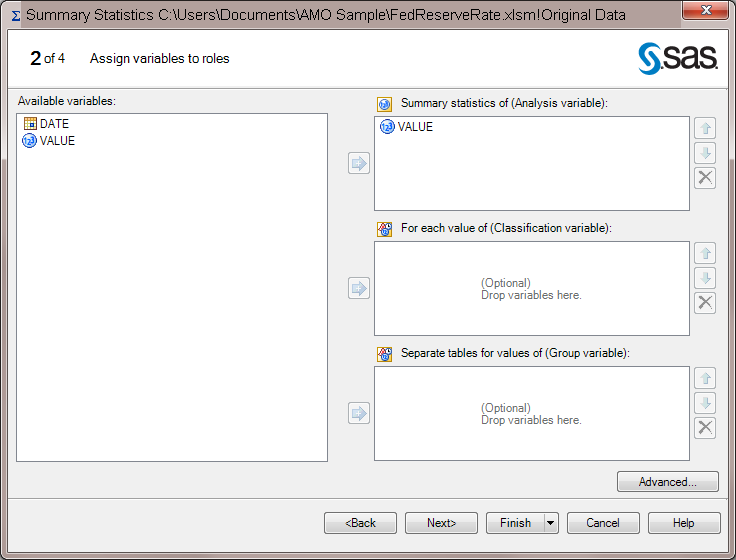 Click Next.
 -
In step 3 of the wizard, click Next to generate the default summary statistics.
-
In step 4 of the wizard, delete the text for the footnote, and then click Finish.The results open in a new worksheet called Summary Statistics.
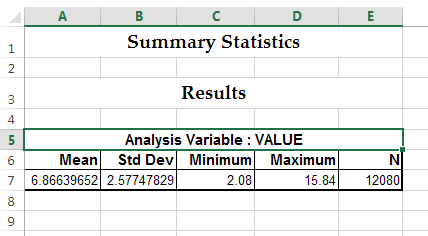 Notice that the style of the results does not match your corporate style.
Copyright © SAS Institute Inc. All Rights Reserved.
Last updated: April 27, 2017