| Response Surface Designs |
Viewing Design Details
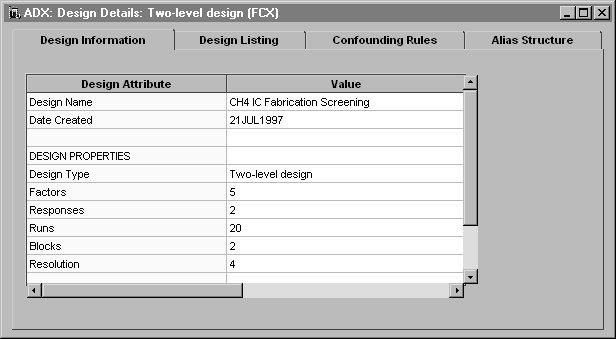
To view a summary of the design, click Design Details. The first tab, Design Information, describes how the design was generated.
|
In this case, the design has 30 runs in three blocks. Two of the blocks contain eight factorial runs and two centerpoints each. The remaining block contains eight axial points and two center points. Information about the axial scaling is also provided.
You can view the design points by clicking the Design Listing tab.
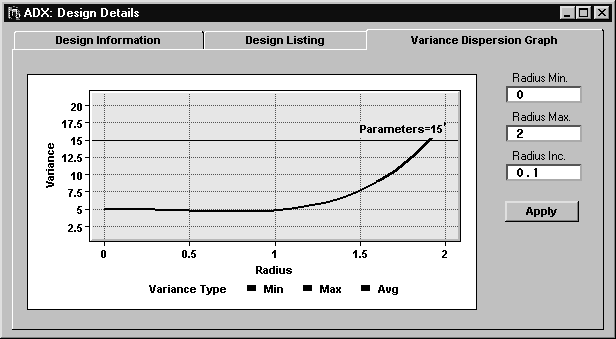
The Variance Dispersion Graph tab generates a graph that is helpful in choosing response surface designs, including the number of center points. The graph displays the prediction variance scaled by the number of runs and the underlying error against the distance away from the center of the experimental region. Refer to Myers and Montgomery (1995, pp. 374ff.) for more information about using variance dispersion graphs.
Close the Design Details window to return to design selection.
|
A sample design with response values is available on the ADX desktop.
Copyright © 2008 by SAS Institute Inc., Cary, NC, USA. All rights reserved.