Data visualization is a powerful technology that is widely used to share insights and information within web content. However, data visualization is inherently visual. As a result, people with visual impairments or blindness do not have equal access to charts, graphs, maps, and other data visualizations on the web.
This guide explains how to enable people with visual impairments or blindness to access data visualizations within your web content using SAS Graphics Accelerator. SAS Graphics Accelerator is a free browser extension that allows people with visual impairments or blindness to interactively explore data visualizations using sonification, read automatically-generated text descriptions, or access underlying data in tabular format. Check out this brief demonstration of SAS Graphics Accelerator.
The benefits of offering accessible alternative presentations of your data visualizations include:
First, you create a semantic description of each data visualization within your web content.
Second, associate each semantic description with the corresponding data visualization using the data-sasga-src attribute on each HTML element that contains a data visualization. Valid elements are
Finally, users with visual impairments or blindness open the accessible alternative presentations of a data visualizations by clicking a button labelled "Accelerate". The alternative presentations are automatically generated from the semantic descriptions provided within the data-sasga-src attributes.
The functionality described in this guide is pre-production and experimental.
The accessibility features and processes described in this document requires using the SAS Graphics Accelerator Chrome Extension, which
When a user opens an accessible alternative presentation of a data visualization by clicking on the "Accelerate" button, a new browser tab opens.
Do you have comments or questions about the features mentioned in this document? Would you like to request support for additional types of data visualizations? Please contact us at accessibility@sas.com.
There are two tutorial guides, one for charts and one for maps.
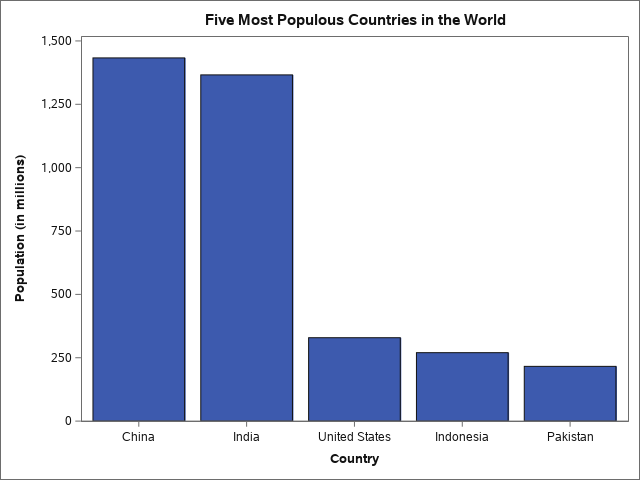
The following data visualization is our example for demonstrating how to integrate SAS Graphics Accelerator with a chart.
The chart is a bar chart with 5 categories, each with a numeric value. The chart shows the five most populous countries in the world and their populations.
In the following steps we will define the semantic description of the chart using the Vega-Lite grammar. We use the Vega-Lite specification because it provides a high-level grammar for easily describing data visualizations. You do not need to use or install Vega-Lite to integrate SAS Graphics Accelerator with a data visualization. SAS Graphics Accelerator has simply implemented support for a subset of the grammar used by Vega-Lite.
The data that makes up the chart is represented as an array of objects, each stored as a set of key/value pairs.
[
    {
        "country": "China",
        "population": 1433
    },
    {
        "country": "India",
        "population": 1366
    },
    {
        "country": "United States",
        "population": 329
    },
    {
        "country": "Indonesia",
        "population": 270
    },
    {
        "country": "Pakistan",
        "population": 216
    }
]
In this case the key names are "country" and "population", but any key names can be used as long as they are valid JSON value names. The same key names must be used for each data point object. Note that numeric values can be stored with or without quotes, but they cannot include commas in either case.
When SAS Graphics Accelerator reads in the data it uses the following rules:
The data can be stored in one of two ways - either in its own file, or as part of the top-level JSON object describing the chart.
If you store the data in its own file, point to it in the top-level JSON with the "url" property:
{
    "data":{
        "url": "populationData.json"
    }
}
If you store the data within the top-level JSON object, define it with the "values" property:
{
    "data": {
        "values": [
            {
                "country": "China",
                "population": 1433
            },
            {
                "country": "India",
                "population": 1366
            },
            {
                "country": "United States",
                "population": 329
            },
            {
                "country": "Indonesia",
                "population": 270
            },
            {
                "country": "Pakistan",
                "population": 216
            }
        ]
    }
}
When used with data-sasga-src, SAS Graphics Accelerator supports bar and line charts.
{"mark": "bar"}
or
{"mark": "line"}
Some other chart types can be expressed as either a bar or line chart with slight modifications.
For each axis, define:
{
    "encoding": {
        "x": {
            "field": "country",
            "type": "nominal",
            "title": "Country"
        },
        "y": {
            "field": "population",
            "type": "quantitative",
            "title": "Population"
        }
    }
}
To set a title on the chart, define it explicitly in the JSON:
{"title": "Populations of the 5 most populous countries in the World"}
SAS Graphics Accelerator doesn’t use the text alternative (alt, aria-label, etc.), if any, defined on the chart in the HTML page.
Combining the components above produces a full semantic description of the chart. The full version below also defines the schema used to describe the chart: the Vega-Lite schema.
{
    "$schema": "https://vega.github.io/schema/vega-lite/v4.json",
    "title": "Populations of the 5 most populous countries in the World",
    "data": {
        "values": [
            {
                "country": "China",
                "population": 1433
            },
            {
                "country": "India",
                "population": 1366
            },
            {
                "country": "United States",
                "population": 329
            },
            {
                "country": "Indonesia",
                "population": 270
            },
            {
                "country": "Pakistan",
                "population": 216
            }
        ]
    },
    "mark": "bar",
    "encoding": {
        "x": {
            "field": "country",
            "type": "nominal",
            "title": "Country"
        },
        "y": {
            "field": "population",
            "type": "quantitative",
            "title": "Population"
        }
    }
}
{
    "$schema": "https://vega.github.io/schema/vega-lite/v4.json",
    "title": "Populations of the 5 most populous countries in the World",
    "data": {
        "url": "populationData.json"
    },
    "mark": "bar",
    "encoding": {
        "x": {
            "field": "country",
            "type": "nominal",
            "title": "Country"
        },
        "y": {
            "field": "population",
            "type": "quantitative",
            "title": "Population"
        }
    }
}
After defining the JSON, attach it to the data visualization by adding a "data-sasga-src" attribute to the <img> tag of the chart. The value of the attribute can be:
It is essential that this attribute is defined before the DOM Ready event, otherwise SAS Graphics Accelerator may not detect the attribute. Here is the above example stored in the two possible formats:
<img src="chart.png" alt="Populations of the 5 most populous countries in the World" data-sasga-src="population.json">
<img src="chart.png" alt="Populations of the 5 most populous countries in the World" data-sasga-src='data:application/json,{"$schema":"https://vega.github.io/schema/vega-lite/v4.json","title":"Populations of the 5 most populous countries in the World","data":{"values":[{"Country":"China","Population":"1433"},{"Country":"India","Population":"1366"},{"Country":"United States","Population":"329"},{"Country":"Indonesia","Population":"270"},{"Country":"Pakistan","Population":"216"}]},"mark":"bar","encoding":{"x":{"field":"Country","type":"nominal","title": "Country"},"y":{"field":"Population","type":"quantitative","title": "Population"}}}'>While an alt attribute is provided that describes the chart, SAS Graphics Accelerator does not use it. Define the title for the chart explicitly in the JSON.
The fully inline JSON version is error prone if it is typed as one continuous string. As an alternative it can be created with Javascript by defining a JSON object with all of the required information, then stringifying the JSON object and adding it as the data-sasga-src attribute to the image element.
Here is the source code for this example.
<img src="topFiveCountryPopulation.png" alt="Five most populous countries in the world" data-sasga-src="population.json">
Here is the population.json referenced in the example.
Test the JSON implementation to ensure it works with SAS Graphics Accelerator and represents the data in the data visualization correctly.
After making the accessible alternative presentation, let users know that this functionality exists. Tell users to install the SAS Graphics Accelerator for Google Chrome to take advantage of it. You can either include a visible message on the page where you present the charts, or visually hide the message so it is only available to screen reading software. We recommend the following technique for notifying users.
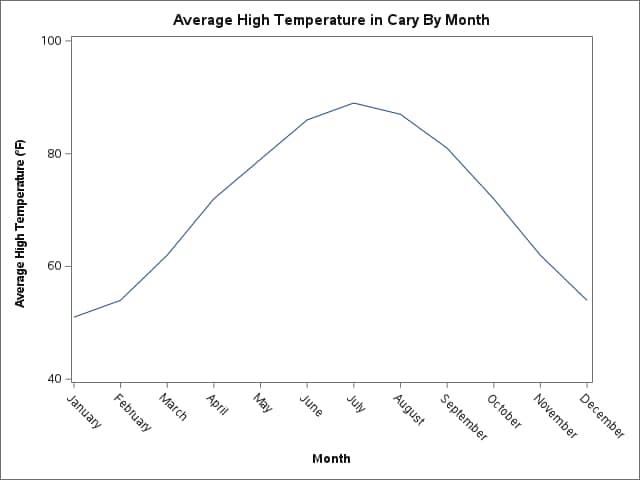
This example shows how to make a line chart. It also demonstrates how to use Javascript to embed a stringified version of the JSON with the chart.
Javascript for creating the JSON
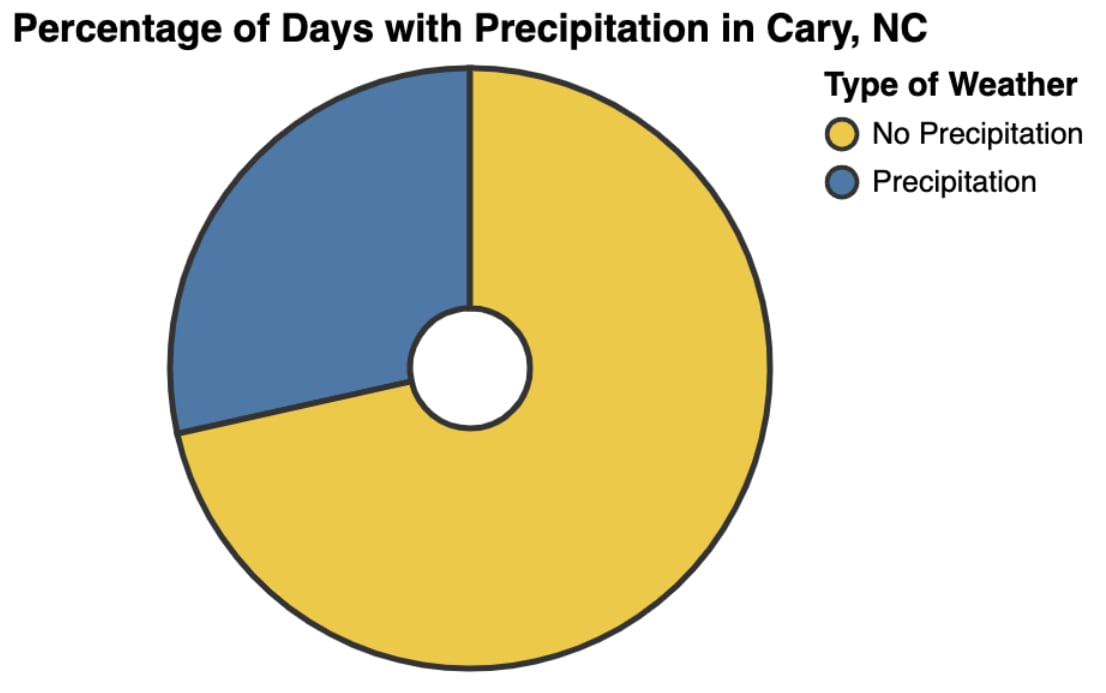
In this example each section of the pie chart is encoded as a bar in a bar chart.
{
    "data": {
        "values": [
            {"category": "Precipitation", "value": 28.5},
            {"category": "No Precipitation", "value": 71.5}
        ]
    }
}
JSON defining semantic description of the pie chart
With D3 charts, or with any graphing library that renders the chart asynchronously or after the DOM ready event, it is critical that the data-sasga-src attribute is present on the chart either:
In this example, as the <svg> element is created we attach the data-sasga-src attribute with the correct value so that it is ready before the DOM Ready event. This is before all of the data for the D3 chart has been loaded and subsequently rendered.
This example shows how to use Vega-Lite to create a chart and integrate it with SAS Graphics Accelerator. This is a two step process. Vega-Lite is a rich grammar used to describe many aspects of how to visually present a chart. SAS Graphics Accelerator does not work with all the possible presentations in Vega-Lite.
We use two JSON objects: one to define how Vega-Lite draws the chart and another to define the semantic description for SAS Graphics Accelerator.
The Vega-Lite grammar is a very rich specification that allows you to describe many aspects of charts. SAS Graphics Accelerator only supports a subset of the grammar and will not accept JSON which includes unsupported key/value pairs.
The following data visualization is our example for demonstrating how to integrate SAS Graphics Accelerator with a map.
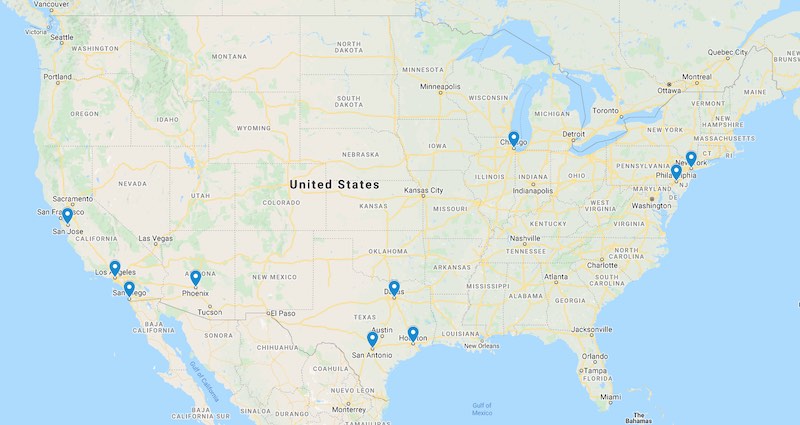
The map shows the location of the 10 most populous cities in the United States.
In the following steps we define the semantic description of the map using the KML notation. Most KML files are produced by other applications. This tutorial does not cover all of the aspects of KML. It only covers the features of KML that SAS Graphics Accelerator supports.
In short, the supported features are:
A KML file can contain content that SAS Graphics Accelerator does not support. In that case, only the supported content is processed and presented to the user.
A sample of the KML for this tutorial is as follows.
<?xml version="1.0" encoding="UTF-8"?>
<kml xmlns="http://www.opengis.net/kml/2.2">
  <Document>
    <name>Top 10 Most Populous Cities in the United States</name>
    <Folder>
      <Placemark>
        <name>New York, New York</name>
        <Point>
          <coordinates>
            -74.0059728,40.7127753,0
          </coordinates>
        </Point>
      </Placemark>
      <Placemark>
        <name>Chicago, Illinois</name>
        <Point>
          <coordinates>
            -87.6297982,41.8781136,0
          </coordinates>
        </Point>
      </Placemark>
      <Placemark>
        <name>Houston, Texas</name>
        <Point>
          <coordinates>
            -95.3698028,29.7604267,0
          </coordinates>
        </Point>
      </Placemark>
      ...
      </Folder>
  </Document>
</kml>
The full data is available at top-ten-cities-us.kml
After defining the KML, attach it to the data visualization by adding a "data-sasga-src" attribute to the <img> tag of the map. The value of the attribute can be:
It is essential that this attribute is defined before the DOM Ready event, otherwise SAS Graphics Accelerator may not detect the attribute. Here is the above example stored in the two possible formats:
<img src="us-10-largest-cities.jpg" alt="Ten most populous cities in the United States" data-sasga-src="top-ten-cities-us.kml">
<img src="us-10-largest-cities.jpg" alt="Ten most populous cities in the United States" data-sasga-src='data:application/vnd.google-earth.kml+xml,<?xml version="1.0" encoding="UTF-8"?><kml xmlns="http://www.opengis.net/kml/2.2"><Document><name>Top 10 Most Populous Cities in the United States</name><Folder><Placemark><name>New York, New York</name><Point><coordinates>-74.0059728,40.7127753,0</coordinates></Point></Placemark><Placemark><name>Chicago, Illinois</name><Point><coordinates>-87.6297982,41.8781136,0</coordinates></Point></Placemark><Placemark><name>Houston, Texas</name><Point><coordinates>-95.3698028,29.7604267,0</coordinates></Point></Placemark><Placemark><name>Los Angeles, California</name><Point><coordinates>-118.2436849,34.0522342,0</coordinates></Point></Placemark><Placemark><name>Phoenix, Arizona</name><Point><coordinates>-112.0740373,33.4483771,0</coordinates></Point></Placemark><Placemark><name>Philadelphia, Pennsylvania</name><Point><coordinates>-75.1652215,39.9525839,0</coordinates></Point></Placemark><Placemark><name>San Antonio, Texas</name><Point><coordinates>-98.4936282,29.4241219,0</coordinates></Point></Placemark><Placemark><name>San Diego, California</name><Point><coordinates>-117.1610838,32.715738,0</coordinates></Point></Placemark><Placemark><name>Dallas, Texas</name><Point><coordinates>-96.7969879,32.7766642,0</coordinates></Point></Placemark><Placemark><name>San Jose, California</name><Point><coordinates>-121.8863286,37.3382082,0</coordinates></Point></Placemark></Folder></Document></kml>'>
While an alt attribute is provided that describes the map, SAS Graphics Accelerator does not use it. Define the title for the map explicitly in the KML.
The fully inline KML version is error prone if it is typed as one continuous string. The value can be added programmatically with Javascript by stringifying a KML document and adding it as the data-sasga-src attribute to the image element.
Here is the source code for this example.
<img src="us-10-largest-cities.jpg" alt="Ten most populous cities in the United States" data-sasga-src="top-ten-cities-us.kml">
Here is the top-ten-cities-us.kml referenced in the example.
Test the KML implementation to ensure it works with SAS Graphics Accelerator and represents the data in the data visualization correctly.
After making the accessible alternative presentation, let users know that this functionality exists. Tell users to install the SAS Graphics Accelerator for Google Chrome to take advantage of it. You can either include a visible message on the page where you present the map, or visually hide the message so it is only available to screen reading software. We recommend the following technique for notifying users.
KML allows a wide range of content to be stored and presented to users. SAS Graphics Accelerator supports a subset of the KML specification. If the KML contains elements that are not supported by SAS Graphics Accelerator, those elements are ignored. If a particular element contains unsupported child elements, all of the supported child elements will still be interpreted by SAS Graphics Accelerator. For example, if a <Placemark> element contains the unsupported <styleUrl> element, other valid elements like <name> and <Point> will still be interpreted .
The following KML nodes are supported.
© 2020 SAS Institute Inc. All Rights Reserved.