<%// BasicRequirements:%>
<%
// Basic requirements for creating a waterfall chart:
// 1) Create a WaterfallChart instance and a data source
// 2) Create a data model and attach the data source to it
// 3) Assign the Category variable role, and optionally the
// Response variable role, to appropriate variable(s)
// 4) Assign the data model to the WaterfallChart
// To set a title or footnote, get the appropriate WaterfallChart
// title or footnote, and then set the returned object's text.
%>
<%@page import="com.sas.servlet.tbeans.graphics.html.WaterfallChart,
com.sas.graphics.components.waterfallchart.WaterfallChartTableDataModel,
com.sas.graphics.components.AnalysisVariable,
com.sas.graphics.components.ClassificationVariable,
javax.swing.table.DefaultTableModel"
%>
<%
// 1) Create a WaterfallChart and a data source
WaterfallChart waterfallChart=new WaterfallChart();
%>
<%@ include file="TransactionData.jsp" %>
<%
// 2) Create a data model and attach the data source
WaterfallChartTableDataModel dataModel=
new WaterfallChartTableDataModel();
dataModel.setModel(dataTable);
// 3) Assign the Category variable role, and optionally the
// Response variable role, to appropriate variable(s).
// This sample sorts category values in descending order, and
// it applies the NLMNLUSD format to the response variable so
// that Transaction amounts in the output are displayed in an
// internationalized representation of US dollars.
dataModel.setCategoryVariable(
new ClassificationVariable("Id"));
dataModel.setResponseVariable(
new AnalysisVariable("TransactionQ1", "nlmnlusd"));
// 4) Assign the data model to the WaterfallChart
waterfallChart.setDataModel(dataModel);
// Set a graph title
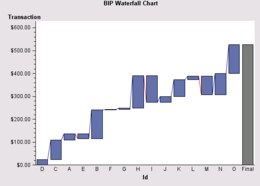
waterfallChart.getTitle1().setText("BIP Waterfall Chart");
// 5) Set HTTP-specific response and request functionality
waterfallChart.setResponse(response);
waterfallChart.setRequest(request);
// Set a graph size and write the chart to the display
waterfallChart.setWidth(600);
waterfallChart.setHeight(450);
waterfallChart.write(out);
%>