<%// SpecifyColumns:%>
<%
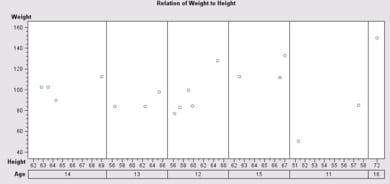
// To generate a scatter plot for each value of a categorical variable
// and align the plots horizontally, assign the Column variable role
// to an appropriate categorical variable. To improve the plot
// appearance, you may need to modify tick display on the X axis.
%>
<%@page import="
com.sas.servlet.tbeans.graphics.html.ScatterPlot,
com.sas.graphics.components.scatterplot.ScatterPlotModel,
com.sas.graphics.components.scatterplot.ScatterPlotTableDataModel,
com.sas.graphics.components.PlotVariable,
com.sas.graphics.components.ClassificationVariable,
com.sas.graphics.components.AxisModel,
com.sas.swing.models.TableModelAdapter,
com.sas.models.SimpleTable"
%>
<%
// Create a ScatterPlot instance
ScatterPlot scatterPlot = new ScatterPlot();
// Create a simple SAS table and add data to it
SimpleTable table = new SimpleTable();
%>
<%@ include file="HeightWeightData.jsp"%>
<%
// Convert a simple SAS table to a simple Java Swing table
TableModelAdapter tma = new TableModelAdapter(table);
tma.setFormattedDataUsed(false);
// Create a data model and attach the data source
ScatterPlotTableDataModel dataModel=
new ScatterPlotTableDataModel(tma);
// Assign the data model to the ScatterPlot
scatterPlot.setDataModel(dataModel);
// Assign the X, Y, and Column variable roles
dataModel.setXVariable(
new PlotVariable("Height"));
dataModel.setYVariable(
new PlotVariable("Weight"));
dataModel.setColumnVariable(
new ClassificationVariable("Age"));
// Modify the X axis
ScatterPlotModel graphModel=scatterPlot.getGraphModel();
AxisModel axisModel = graphModel.getXAxisModel();
axisModel.setContinuousMajorTickCount(4);
axisModel.setContinuousMinorTickCount(1);
// Set a graph title and size
scatterPlot.getTitle1().setText(
"Relation of Weight to Height");
scatterPlot.setWidth(600);
scatterPlot.setHeight(300);
// Set HTTP-specific response and request functionality
scatterPlot.setResponse(response);
scatterPlot.setRequest(request);
// Write the plot to the display
scatterPlot.write(out);
%>