<%// ChangeLine:%>
<%
// A graph's display properties (marker symbol, axis characteristics, and
// so on) are general properties that are defined in the graph's model. The
// line style for a needle lines is defined as a LineStyle that
// is applied to the plot needles. Thus, to change the line style for needles,
// 1) Get the ScatterPlot's model
// 2) Define a LineStyle for the needle lines
// 3) Set the LineStyle by calling setNeedleLineStyle()
%>
<%@page import="
com.sas.servlet.tbeans.graphics.html.ScatterPlot,
com.sas.graphics.components.scatterplot.ScatterPlotTableDataModel,
com.sas.graphics.components.ClassificationVariable,
com.sas.graphics.components.PlotVariable,
com.sas.graphics.components.DataElementStyles,
com.sas.graphics.components.GraphConstants,
com.sas.graphics.components.MarkerStyle,
com.sas.graphics.components.scatterplot.ScatterPlotModel,
com.sas.graphics.components.LineStyle,
com.sas.measures.BaseLength,
com.sas.swing.models.TableModelAdapter,
com.sas.models.SimpleTable,
java.awt.Color"
%>
<%
// Create a ScatterPlot instance
ScatterPlot scatterPlot = new ScatterPlot();
// Create a simple SAS table and add data to it
SimpleTable table = new SimpleTable();
%>
<%@ include file="HeightWeightData.jsp"%>
<%
// Convert a simple SAS table to a simple Java Swing table
TableModelAdapter tma = new TableModelAdapter(table);
tma.setFormattedDataUsed(false);
// Create a data model and attach the data source
ScatterPlotTableDataModel dataModel=
new ScatterPlotTableDataModel(tma);
// 1) Get the plot's graph model
ScatterPlotModel graphModel=scatterPlot.getGraphModel();
// 2) Define a LineStyle for the needle lines
LineStyle lineStyle = new LineStyle(
Color.red,
new BaseLength(3, "pt"),
GraphConstants.TRUE);
// 3) Set the LineStyle on the needles
graphModel.setNeedleLineStyle(lineStyle);
// Enable interpolations and get the DataElementStyles
graphModel.setInterpolationEnabled(true);
DataElementStyles des = graphModel.getDataElementStyles() ;
// Get the array of MarkerStyles
MarkerStyle[] markerStyles = des.getMarkerStyles();
// Specify the interpolation method
markerStyles[0].setInterpolation(MarkerStyle.INTERPOLATION_VERTICAL_NEEDLES);
// Assign the X and Y variable roles
dataModel.setXVariable(
new PlotVariable("Height"));
dataModel.setYVariable(
new PlotVariable("Weight"));
dataModel.setGroupVariable(
new ClassificationVariable("Gender"));
// Assign the data model to the ScatterPlot
scatterPlot.setDataModel(dataModel);
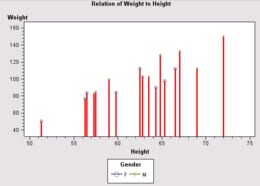
// Set a graph title
scatterPlot.getTitle1().setText(
"Relation of Weight to Height");
// Set HTTP-specific response and request functionality
scatterPlot.setResponse(response);
scatterPlot.setRequest(request);
// Write the plot to the display
scatterPlot.write(out);
%>