<%// BasicRequirements:%>
<%
// Basic requirements for creating a scatter plot:
// 1) Create a ScatterPlot instance
// 2) Create a simple SAS table and add data to it
// 3) Convert the SAS table to a Java Swing table
// 4) Create a data model and attach the data source
// 5) Assign the X and Y variable roles
// 6) Assign the data model to the ScatterPlot
// To set a title or footnote, get the appropriate ScatterPlot
// title or footnote, and then set the returned object's text.
%>
<%@page import="
com.sas.servlet.tbeans.graphics.html.ScatterPlot,
com.sas.graphics.components.scatterplot.ScatterPlotTableDataModel,
com.sas.graphics.components.PlotVariable,
com.sas.swing.models.TableModelAdapter,
com.sas.models.SimpleTable"
%>
<%
// 1) Create a ScatterPlot instance
ScatterPlot scatterPlot = new ScatterPlot();
// 2) Create a simple SAS table and add data to it
SimpleTable table = new SimpleTable();
%>
<%@ include file="HeightWeightData.jsp"%>
<%
// 3) Convert the SAS table to a Java Swing table
TableModelAdapter tma = new TableModelAdapter(table);
tma.setFormattedDataUsed(false);
// 4) Create a data model and attach the data source
ScatterPlotTableDataModel dataModel=
new ScatterPlotTableDataModel(tma);
// 5) Assign the X and Y variable roles
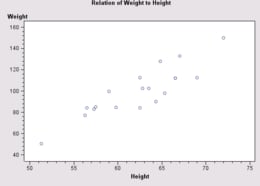
dataModel.setXVariable(
new PlotVariable("Height"));
dataModel.setYVariable(
new PlotVariable("Weight"));
// 6) Assign the data model to the ScatterPlot
scatterPlot.setDataModel(dataModel);
// Set a graph title and size
scatterPlot.getTitle1().setText(
"Relation of Weight to Height");
scatterPlot.setWidth(400);
scatterPlot.setHeight(300);
// Set HTTP-specific response and request functionality
scatterPlot.setResponse(response);
scatterPlot.setRequest(request);
// Write the plot to the display
scatterPlot.write(out);
%>