<%// SetBaseline:%>
<%
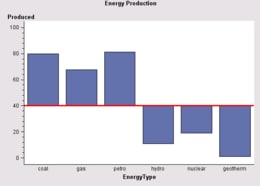
// The BarChartModel class lets you set a reference line that
// serves as a base line for the bar chart. Response values greater
// than the baseline value are displayed as bars above the baseline,
// and response values below the baseline value are displayed as
// bars below the baseline value. To set the baseline, call the
// BarChartModel's setResponseAxisBaselineModel() method.
%>
<%@page import="
com.sas.servlet.tbeans.graphics.html.BarChart,
com.sas.graphics.components.barchart.BarChartTableDataModel,
com.sas.graphics.components.AnalysisVariable,
com.sas.graphics.components.ClassificationVariable,
com.sas.graphics.components.barchart.BarChartModel,
com.sas.graphics.components.ReferenceLineModel,
com.sas.graphics.components.GraphConstants,
com.sas.graphics.components.StrokeLineStyle,
com.sas.measures.BaseLength,
com.sas.swing.models.TableModelAdapter,
com.sas.models.SimpleTable,
java.awt.Color"
%>
<%
// Create a BarChart instance
BarChart barChart = new BarChart();
// Create a simple SAS table and add data to it
SimpleTable table = new SimpleTable();
%>
<%@ include file="EnergyData.jsp" %>
<%
// Convert a simple SAS table to a simple Java Swing table
TableModelAdapter tma = new TableModelAdapter(table);
tma.setFormattedDataUsed(false);
// Create a data model and attach the data source
BarChartTableDataModel dataModel=
new BarChartTableDataModel(tma);
// Assign the data model to the BarChart
barChart.setDataModel(dataModel);
// Define a line style for the baseline
StrokeLineStyle lineStyle=new StrokeLineStyle(
StrokeLineStyle.SASGRAPH_LINE01,
Color.red,
new BaseLength(3, "pt"),
GraphConstants.TRUE);
// Create a reference line for the baseline
ReferenceLineModel refModel = new ReferenceLineModel();
refModel.setLineStyle(lineStyle);
refModel.setPosition(40);
// Set the baseline on the response axis
barChart.getGraphModel()
.setResponseAxisBaselineModel(refModel);
// Assign the Category variable role, and the
// BarResponse and LineResponse variable roles
dataModel.setCategoryVariable(
new ClassificationVariable("EnergyType"));
dataModel.setResponseVariable(
new AnalysisVariable("Produced"));
// Set a graph title
barChart.getTitle1().setText(
"Energy Production");
// Set HTTP-specific response and request functionality
barChart.setResponse(response);
barChart.setRequest(request);
// Write the chart to the display
barChart.write(out);
%>