<%// MultipleResponses:%>
<%
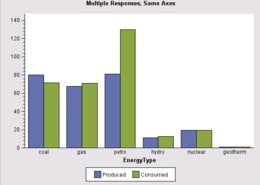
// To graph mutliple Response variables by the same Category variable,
// add the Response variables to an AnalysisVariableList, and then
// assign the Response role to that list rather than to an individual variable.
%>
<%@page import="
com.sas.servlet.tbeans.graphics.html.BarChart,
com.sas.graphics.components.ClassificationVariable,
com.sas.graphics.components.AnalysisVariable,
com.sas.graphics.components.AnalysisVariableList,
com.sas.graphics.components.barchart.BarChartModel,
com.sas.graphics.components.barchart.BarChartTableDataModel,
com.sas.swing.models.TableModelAdapter,
com.sas.models.SimpleTable"
%>
<%
// Create a BarChart instance
BarChart barChart = new BarChart();
// Create a simple SAS table and add data to it
SimpleTable table = new SimpleTable();
%>
<%@ include file="EnergyData.jsp" %>
<%
// Convert a simple SAS table to a simple Java Swing table
TableModelAdapter tma = new TableModelAdapter(table);
tma.setFormattedDataUsed(false);
// Create a data model and attach the data source
BarChartTableDataModel dataModel=
new BarChartTableDataModel(tma);
// Assign the data model to the BarChart
barChart.setDataModel(dataModel);
// Get the graph model
BarChartModel graphModel=barChart.getGraphModel();
// Define multiple Response variables
AnalysisVariableList multiResponse=new AnalysisVariableList(
new AnalysisVariable[] {
new AnalysisVariable("Produced"),
new AnalysisVariable("Consumed")
} );
// Assign the Category and Response variable roles
dataModel.setCategoryVariable(new ClassificationVariable("EnergyType"));
dataModel.setResponseVariable(multiResponse);
// Set a graph title
barChart.getTitle1().setText(
"Multiple Responses, Same Axes");
// Set HTTP-specific response and request functionality
barChart.setResponse(response);
barChart.setRequest(request);
// Write the chart to the display
barChart.write(out);
%>