// ChangeBarAppearance:
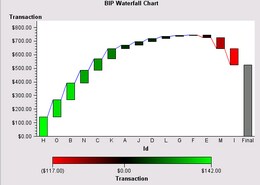
// The WaterfallChartModel interface has numerous methods to control the chart
// appearance. This sample uses some of those methods to change bar width, the
// space between bars, and to set bar colors so that they represent response values

   import com.sas.graphics.components.waterfallchart.WaterfallChart;
   import com.sas.graphics.components.waterfallchart.WaterfallChartTableDataModel;
   import com.sas.graphics.components.AnalysisVariable;
   import com.sas.graphics.components.ClassificationVariable;
   import com.sas.graphics.components.GraphConstants;
   import com.sas.measures.BaseLength;
   import javax.swing.table.DefaultTableModel;
   import java.awt.BorderLayout;
   import java.awt.Color;
   import java.awt.Container;
   import java.awt.event.WindowAdapter;
   import java.awt.event.WindowEvent;
   import javax.swing.JFrame;
   import javax.swing.JPanel;

   public class ChangeBarAppearance extends JPanel  {
     private ChangeBarAppearance  theApp;
     public ChangeBarAppearance () {
        setLayout(new BorderLayout());

     // Create a WaterfallChart and a data source
        WaterfallChart waterfallChart=new WaterfallChart();
        SampleData dataTable=new SampleData();

     // Create a data model and attach the data source
        WaterfallChartTableDataModel dataModel=
                  new WaterfallChartTableDataModel();
        dataModel.setModel(dataTable);

     // Assign the variable roles and sort category values in descending order
        dataModel.setCategoryVariable(
                 new ClassificationVariable("Id", GraphConstants.SORT_DESCENDING));

     // Assign the Response variable role and apply the NLMNLUSD format so
     // that Transaction amounts in the output are displayed in an
     // internationalized representation of US dollars.
        dataModel.setResponseVariable(
                  new AnalysisVariable("Transaction", "nlmnlusd"));

     // Call the data model's setCategorySortVariable() method
     // to sort bars according to the values of the response variable
        dataModel.setCategorySortVariable(dataModel.getResponseVariable());

     // Set the bar width and the space between bars
        waterfallChart.getGraphModel().setBarWidth(new BaseLength(7,"px"));
        waterfallChart.getGraphModel().setBarWidthSpace(new BaseLength(5,"px"));

     // Style bars according to response values, and set a three-color palette
        dataModel.setStyleByVariable(dataModel.getResponseVariable());
        waterfallChart.getGraphModel().setColorPaletteType(GraphConstants.COLOR_PALETTE_THREE_COLOR_CONTINUOUS);

     // Assign data-element colors so that palette colors are assigned to the bars
        waterfallChart.getGraphModel().getDataElementStyles().setContinuousFillThreeColorStartColor(Color.red);
        waterfallChart.getGraphModel().getDataElementStyles().setContinuousFillThreeColorNeutralColor(Color.black);
        waterfallChart.getGraphModel().getDataElementStyles().setContinuousFillThreeColorEndColor(Color.green);

     // Assign the data model to the WaterfallChart
        waterfallChart.setDataModel(dataModel);

     // Set a graph title
        waterfallChart.getTitle1().setText("BIP Waterfall Chart");
        add(waterfallChart, BorderLayout.CENTER);
      }
   // Create the data source
      static private class SampleData extends DefaultTableModel {
        private static Class  columnClass[]={Double.class, String.class};
        private static String columnNames[]={  "Transaction"  ,  "Id"  };
          public SampleData() {
	    super();
            Object data[][] = {
                                  {new Double(  23),"D"}
                                , {new Double(  85),"C"}
                                , {new Double(  27),"A"}
                                , {new Double( -20),"E"}
                                , {new Double( 125),"B"}
                                , {new Double(   3),"F"}
                                , {new Double(   6),"G"}
                                , {new Double( 142),"H"}
                                , {new Double(-117),"I"}
                                , {new Double(  26),"J"}
                                , {new Double(  73),"K"}
                                , {new Double(  16),"L"}
                                , {new Double( -82),"M"}
                                , {new Double(  93),"N"}
                                , {new Double( 126),"O"}
            };
            setDataVector(data, columnNames);
          }
          public Class getColumnClass(int column) {
	    return columnClass[column];
	  }
      }
      public static void main(String[] args) {
      	  JFrame frame = new JFrame("BIP Graph Sample");
      	  Container container = frame.getContentPane();
          container.setLayout(new BorderLayout());
          container.setBackground(Color.white);

          JPanel bipPanel = new JPanel();
          bipPanel.setLayout(new BorderLayout());
          ChangeBarAppearance  bipGraphSample = new ChangeBarAppearance ();

          bipPanel.add(bipGraphSample, BorderLayout.CENTER);
          container.add(bipPanel, BorderLayout.CENTER);

          frame.setSize(600,450);
          frame.addWindowListener(new WindowAdapter() {
              public void windowClosing(WindowEvent e) {
                     System.exit(0);
              }
          } );
          frame.setVisible(true);
      }
   }