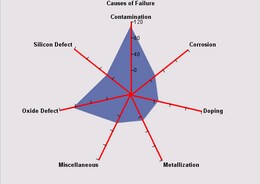
When the specifications on the data model generate multiple stars, the stars overlap each other on the axis lines. By default, the area within each star is filled, and a unique FillStyle is used to fill each area.
To change the fill style within the star areas, use the chart's DataElementStyles to set an alternative FillStyle array. The following code fragment sets the solid fill colors red, green, and blue:
// Define a new set of solid fills with the colors red, green, blue
FillStyle[] fillStyles=new FillStyle[] {
            new FillStyle(java.awt.Color.red),
            new FillStyle(java.awt.Color.green),
            new FillStyle(java.awt.Color.blue) };
RadarChart radarChart=new RadarChart();
RadarChartModel graphModel=radarChart.getGraphModel();
graphModel.getDataElementStyles().setFillStyles(fillStyles);
The RadarChartModel can be used to change general display properties. For example, the following example sets a gray background behind a radar chart:
// Create a RadarChart and get its graph model
   RadarChart radarChart = new RadarChart();
   RadarChartModel radarChartModel = radarChart.getGraphModel();

// Assign background color
   radarChartModel.setBackgroundFillStyle(new FillStyle(Color.lightGray));
Rather than changing individual properties, it may be easier to use the RadarChart to set a graph style, which makes it easier to manage multiple display properties.
By default, the starting position for the first spoke (axis line) in a radar chart is at 0 degrees (12 o'clock position). To change the first spoke's starting angle, get the RadarChart's graph model and call the model's setStartAngle() method.
For example, the following specification sets a starting angle of 20 degrees:
RadarChart radarChart=new RadarChart();
radarChart.getGraphModel().setStartAngle(20);
By default, a RadarChart generates a Wedge shape for the radar type. To change radar type, get the RadarChart's graph model and call the model's setRadarType() method. The setRadarType() method takes a single argument, which is a constant that indicates the radar type. See the Field Summary for the RadarChartModel class for the available RADAR_TYPEs.

The following code fragment sets a Radial radar type:
RadarChart radarChart=new RadarChart();
radarChart.getGraphModel().setUniformAxes(false);
radarChart.getGraphModel().setRadarType(RadarChartModel.RADAR_TYPE_RADIAL);
When setting the type, you must be sure that the data are suitable for that type. For example, code that sets the radar type to Radial may have to first call the graph model's setUniformAxes() method to enable the axes to represent different data ranges.
A RadarChartModel can be used to modify the line style (color, width, visibility, ...) of any of the various lines in a RadarChart.

The following table shows the lines you can set and the method(s) to call to access and/or set the line attributes.
| To change ... | Call ... |
|---|---|
| polygon outlines | getDataElementStyles().setOutlineLineStyle(LineStyle) |
| axis lines
(axis, grid, tick, and reference lines) |
getAxisModel() and use the returned AxisModel to set axis line style, grid line styles, major tick styles, minor tick styles, and reference line models |
| legend frame | getColorLegendModel().setFrameLineStyle(LineStyle) |
| missing-values lines | getDataElementStyles().setMissingLineStyle(StrokeLineStyle) |
| column axis lines (available when ColumnVariable role is used) |
getColumnAxisModel().setFrameLineStyle(LineStyle) |
| row axis lines (available when RowVariable role is used) |
getRowAxisModel().setFrameLineStyle(LineStyle) |
| frame lines around column/row cells
(available when ColumnVariable and/or RowVariable roles are used) |
setFrameLineStyle(LineStyle) |
The following code fragment specifies a 3-point red line for the axis lines:
LineStyle lineStyle=new LineStyle(
   Color.red,
   new BaseLength(3, "pt"),
   GraphConstants.TRUE);

RadarChart radarChart=new RadarChart(dataModel);
radarChart.getGraphModel().getAxisModel()
          .setAxisLineStyle(lineStyle);
RadarChartModel properties are bound properties. Modifying a property triggers a PropertyChangeEvent. The RadarChart asynchronously updates when a PropertyChangeEvent is received from the RadarChartModel. Similarly, modifying a property in any of the RadarChartModel's contained models triggers a PropertyChangeEvent. PropertyChangeEvent from contained models will bubble up to cause a PropertyChangeEvent to be fired from the RadarChartModel.
For example, the following call
radarChartModel.getColorLegendModel().getValueTextStyle().setColor(java.awt.Color.yellow);
would cause the legend's value text style model to fire a "color" PropertyChangeEvent, causing legend model to fire a "valueTextStyle" PropertyChangeEvent, causing the RadarChartModel to fire a "colorLegendModel" PropertyChangeEvent. This bubbling up of events enables the graph or any other listener to manage updates at a higher level of containment.