The minimum specification for a RadarChart requires a valid data model. Generally the data model should assign the Category variable role to a ClassificationVariable, but if the role is not assigned, the RadarChart automatically assigns it to the first string column found in the data model, or to the first numeric column if the model has no string column. If a response variable is not specified, the chart statistic represents the category variable’s frequency count.
Chart statistics are displayed along spokes that radiate from the center of the chart. The charts are often stacked on top of one another with reference circles, thus giving them the look of a radar screen.
By default, chart vertices--the points where the statistical values intersect the spokes--are based on the frequencies associated with the levels of a single numeric variable, but they can be scored with a weight variable. Non-integer values of the chart variable are truncated to integers. The measures can be displayed in decreasing order, the order in which they appear in the input data, increasing order of internal values, or lexicographic order of variable names.
The component can use the values of a subgroup variable to show multiple charts on a common set of spokes, based on the value of the subgroup variable. In addition, it can use the values of multiple classification variables, producing separate charts for the additional values. The multiple charts can be arranged in columns (using the ColumnVariable role), rows (using the RowVariable role), or a graph matrix (using both roles). A separate chart is generated for each unique column or row value, or for each value pair when both a column and row variable are specified.
A radar chart's data properties are defined in a data model that descends from RadarChartDataModel, an abstract class whose subclasses provide a handle to the data and determine the number and arrangement of data elements (radars). RadarChartDataModel has the following subclasses:
A RadarChart's individual display properties can be set by calling the RadarChart's getGraphModel() method, which returns a RadarChartModel that can be used to set the desired properties. The RadarChartModel class contains
Although modifying the RadarChartModel provides considerable control, it can be tedious to modify properties individually. For example, graphs distinguish between different types of text, such as label text, value text, data-label text, and title text. Whereas the RadarChartModel can independently control these different text types, doing so requires you to apply the same properties to all applicable locations.
An easier way to set a RadarChart's display properties is to apply a pre-defined GraphStyle to the chart. A graph style sets many of the graph's visual characteristics, such as its use of colors, fonts, background, transparency, drop shadows, and more. A graph style can be used as is or modified through the GraphStyle class.
A graph style can be specified as an argument on a RadarChart's constructor. Or, it can be applied to an existing chart by calling the RadarChart's applyGraphStyle() method as follows:
RadarChart radarChart = new RadarChart();
radarChart.applyGraphStyle(new GraphStyle(GraphStyle.STYLE_SCIENCE);
Applying a GraphStyle to a graph propagates the GraphStyle's properties onto all applicable graph properties, including those in the graph model.
Rather than use the style as is, you can modify it before applying it. Modifying the style definition is typically easier and more convenient than modifying the graph's individual display properties. For example, the GraphStyle class contains only a single set of value text propertes. After applying the modified style, you can still adjust individual properties through the graph model.
The following code fragment modifies a graph style before applying it to a radar chart.
// Create and modify a graph style
GraphStyle graphStyle = new GraphStyle(GraphStyle.STYLE_SCIENCE);
   graphStyle.getValueTextStyle().setColor(Color.darkGray);
   graphStyle.getValueTextStyle().setFont(new java.awt.Font("Arial",Font.BOLD,14));

// Apply the modified graph style to a chart
RadarChart radarChart = new RadarChart();
   radarChart.applyGraphStyle(graphStyle);
Whether you set a graph style or individual display properties, the new display settings override any previous settings that were applied to the graph. For example, if a gray background has been set on a graph, and then a style is applied to that same graph, the style's background setting replaces the previously set gray background.
The RadarChart component supports four titles and two footnotes, each with its own display attributes. To display multiple lines of text with the same attributes, use the line-end character (\n) in the specified text string.
To assign a title or footnote,
The easiest way to set the text for a title or footnote is to get the chart's title or footnote property and set its text as follows:
radarChart.getTitle1().setText("Line One\nLine Two");
To change the text attributes for a title or footnote, set the attributes on a NoteModel and assign the NoteModel to the appropriate title or footnote. The following example sets the title "Product Revenue" and displays it in blue, using a 24-point TimesRoman font with a drop shadow.
NoteModel myTitle = new NoteModel( "Product Revenue" );
myTitle.getTextStyle().setColor(Color.blue);
myTitle.getTextStyle().setFont(new java.awt.Font("TimesRoman",Font.PLAIN,24));
myTitle.getTextStyle().getShadowStyle().setVisible(true);

// Create the graph and assign the title
RadarChart radarChart = new RadarChart();
radarChart.setTitle1( myTitle );
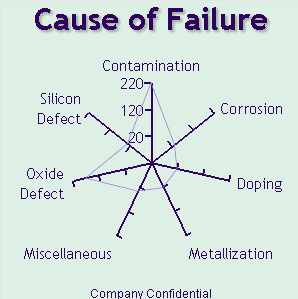
This example graphs the causes of failure in an industrial process. It uses relational data from a Swing TableModel that contains a string column identifying the causes of failure, and a numeric column showing the frequency of each failure. To enhance the graph's appearance, the example assigns the "Analysis" GraphStyle to the chart.
javax.swing.table.TableModel myData = <...>;

// Create the RadarChart's data model.
   RadarChartTableDataModel radarChartDataModel = new RadarChartTableDataModel( myData );
   radarChartDataModel.setCategoryVariable( new ClassificationVariable("Failure") );
   radarChartDataModel.setResponseVariable( new AnalysisVariable("Count") );

// Create the RadarChart applying the data model and the Analysis GraphStyle
   RadarChart radarChart = new RadarChart( radarChartDataModel, new GraphStyle(GraphStyle.STYLE_ANALYSIS) );
   radarChart.setTitle1( new NoteModel("Causes of Failure") );
   radarChart.setFootnote1( new NoteModel("Company Confidential") );
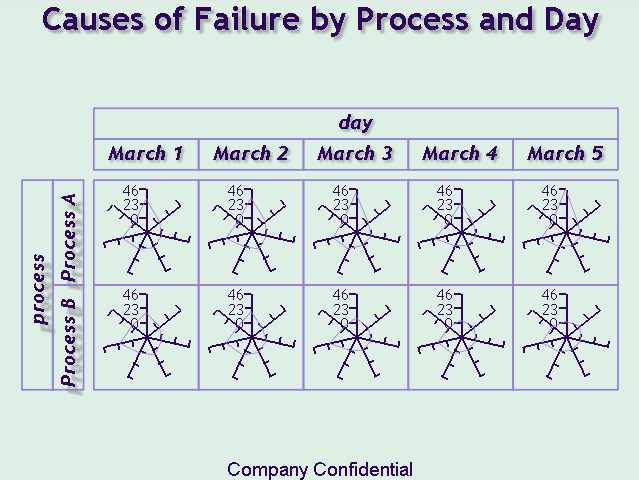
In this next example, the TableModel also contains a column named "Process" that identifies which manufacturing process was used, and it contains a column named "Day" that identifies the date. The example organizes the graph by process and date.
javax.swing.table.TableModel myData = <...>;

// Create the RadarChart's data model.
   RadarChartTableDataModel radarChartDataModel = new RadarChartTableDataModel( myData );
   radarChartDataModel.setColumnVariable( new ClassificationVariable("Day") );
   radarChartDataModel.setRowVariable( new ClassificationVariable("Process") );
   radarChartDataModel.setCategoryVariable( new ClassificationVariable("Product") );
   radarChartDataModel.setResponseVariable( new AnalysisVariable("Revenue") );

// Create the RadarChart applying the data model and the "Analysis" GraphStyle
   RadarChart radarChart = new RadarChart( radarChartDataModel, new GraphStyle(GraphStyle.STYLE_ANALYSIS) );
   radarChart.setTitle1( new NoteModel("Cause of Failure by Process and Day") );
   radarChart.setFootnote1( new NoteModel("Company Confidential") );
This next example compares the failures on all dates across the two processes.
javax.swing.table.TableModel myData = <...>;

// Create the RadarChart's data model.
   RadarChartTableDataModel radarChartDataModel = new RadarChartTableDataModel( myData );
   radarChartDataModel.setSubgroupVariable( new ClassificationVariable("Process") );
   radarChartDataModel.setResponseVariable( new ClassificationVariable("Count") );
   radarChartDataModel.setCategoryVariable( new ClassificationVariable("Failure") );

// Create the RadarChart applying the data model and the "Analysis" GraphStyle
   RadarChart radarChart = new RadarChart( radarChartDataModel, new GraphStyle(GraphStyle.STYLE_ANALYSIS) );
   radarChart.setTitle1( new NoteModel("Causes of Failure") );
   radarChart.setFootnote1( new NoteModel("Company Confidential") );

The RadarChart asynchronously updates when a PropertyChangeEvent is received from any of its models (DataModel, GraphModel or NoteModels).