A LinePlotModel can modify plot markers by
As an alternative to using these techniques for changing plot markers, a variable role in a LinePlotTableDataModel can be used to control the markers according to the values of a data column in the graph's data source.
To use the MarkerStyle class to set plot marker attributes (color, visibility, symbol, size),
For example, the following code fragment specifies a filled square as the marker shape:
LinePlotModel graphModel=linePlot.getGraphModel();
MarkerStyle[] markerStyle=new MarkerStyle[] {
              new MarkerStyle(MarkerStyle.SYMBOL_SQUARE_FILLED)};
graphModel.getDataElementStyles().setMarkerStyles(markerStyle);
To hide plot markers, call the LinePlotModel's setMarkerEnabled() method with the argument value false.
In addition to changing the markers, the LinePlotModel can be used to change other general display properties, as shown in the following example.
LinePlot linePlot = new LinePlot();
LinePlotModel linePlotModel = linePlot.getGraphModel();

// Define a new set of line styles and set their width to 3 pixels and colors to [red, blue, green].
StrokeLineStyle[] lineStyles = new StrokeLineStyle[] {
   new StrokeLineStyle(new BasicStroke(3), new Color(128,128, 255)) //blue
 , new StrokeLineStyle(new BasicStroke(3), new Color(212, 128,64)) //orange
 , new StrokeLineStyle(new BasicStroke(3), new Color(0,128,128)) //green
 , new StrokeLineStyle(new BasicStroke(3), new Color(128,0,128)) //purple
};
linePlotModel.getDataElementStyles().setLineStyles(lineStyles);

// Set markers enabled so that markers are displayed at the data points.
linePlotModel.setMarkerEnabled(true);

// Define a new set of marker styles and modify interpolation
MarkerStyle[] markerStyles = new MarkerStyle[] {
   new MarkerStyle(MarkerStyle.SYMBOL_TRIANGLE_BOLD, Color.red)
 , new MarkerStyle(MarkerStyle.SYMBOL_TRIANGLE_DOWN_BOLD, Color.green)
 , new MarkerStyle(MarkerStyle.SYMBOL_X_BOLD, Color.blue)
};
markerStyle[0].setInterpolation(com.sas.graphics.components.MarkerStyle.INTERPOLATION_STRAIGHT);
linePlotModel.getDataElementStyles().setMarkerStyles(markerStyles);

// set the y-axis value text color to red
linePlotModel.getYAxisModel().getValueTextStyle().setColor(Color.red);
Here is a more complex example using a data set with error columns:
LinePlot linePlot = new LinePlot();
LinePlotModel linePlotModel = linePlot.getGraphModel();
linePlotModel.setMatchErrorColor(false);

// Define the errorLineStyles
StrokeLineStyle[] lineStyles = new StrokeLineStyle[] {
   new StrokeLineStyle(new BasicStroke(2), Color.yellow)}  // Yellow for LeftError
 , new StrokeLineStyle(new BasicStroke(3), Color.blue)}    // Blue for the RightError
 , new StrokeLineStyle(new BasicStroke(3), Color.red)}     // Red for UpError
 , new StrokeLineStyle(new BasicStroke(3), Color.green)}   // Green for DownError
};
// Set the errorLineStyles in the dataElementStyles
linePlotModel.getDataElementStyles().setErrorLineStyles(lineStyles);

// Define the errorMarkerStyles:
MarkerStyle[] markerStyles = new MarkerStyle[] {
   new MarkerStyle(MarkerStyle.SYMBOL_TRIANGLE_LEFT_BOLD, Color.yellow)} // Yellow for LeftError
 , new MarkerStyleMarkerStyle.SYMBOL_TRIANGLE_RIGHT_BOLD, Color.blue)}   // Blue for the RightError
 , new MarkerStyle(MarkerStyle.SYMBOL_TRIANGLE_BOLD, Color.red)}         // Red for UpError
 , new MarkerStyle(MarkerStyle.SYMBOL_TRIANGLE_DOWN_BOLD, Color.green)}  // Green for DownError
};
// Set the errorMarkerStyles in the dataElementStyles
linePlotModel.getDataElementStyles().setErrorMarkerStyles(markerStyles);
Rather than changing individual properties, it may be easier to use the LinePlot to set a graph style, which makes it easier to manage multiple display properties.
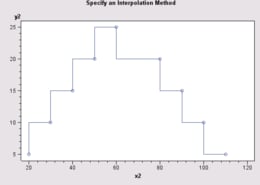
By default for a LinePlotModel, plot markers are disabled and plot points are connected with an interpolated line that uses the MarkerStyle.INTERPOLATION_SPLINE interpolation method. You can disable the interpolation so the plot just displays plot markers, or you can change the interpolation method.
The default sort order for connecting plot points with an interpolated line is the order that the values exist in the data, which is not necessarily the sort order of values along the X axis. Thus, the interpolation line for a single plot can change direction and cross over itself. A LinePlotTableDataModel's SortVariable role can be used to base the sorting order on the values of a variable in the data.
To disable interpolation, call the setInterpolationEnabled() method with the argument value false. Because plot markers are disabled by default, you must also display plot markers by calling the setMarkerEnabled() method with the argument value true:
LinePlotModel graphModel = linePlot.getGraphModel();
graphModel.setInterpolationEnabled(false);
graphModel.setMarkerEnabled(true);
To specify an interpolation method when interpolation is enabled, use the plot's DataElementStyles to get the array of MarkerStyles, and then use a MarkerStyle element to set an interpolation value on the setInterpolation() method. The following code fragment sets a step-right interpolation:
LinePlotModel graphModel=linePlot.getGraphModel();
DataElementStyles des=graphModel.getDataElementStyles();
MarkerStyle[] markerStyles=des.getMarkerStyles();
markerStyles[0].setInterpolation(MarkerStyle.INTERPOLATION_STEP_RIGHT);
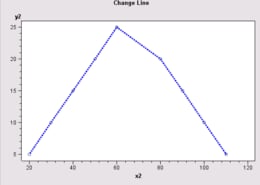
A LinePlotModel can be used to modify the line style (color, width, visibility, ...) of any of the various lines in a LinePlot.
The following table shows the lines you can set and the method(s) to call to access and/or set the line attributes.
| To change ... | Call ... |
|---|---|
| marker outlines | getDataElementStyles().setOutlineLineStyle(LineStyle) |
| plot line(s) | getDataElementStyles().setLineStyles(StrokeLineStyle[] ) |
| needle lines | setNeedleLineStyle(LineStyle newNeedleLineStyle) |
| X axis lines
(axis, grid, tick, and reference lines) |
getXAxisModel() and use the returned AxisModel to set axis line style, grid line styles, major tick styles, minor tick styles, and reference line models |
| Y (left) axis lines
(axis, grid, tick, and reference lines) |
getYAxisModel() and use the returned AxisModel to set axis line style, grid line styles, major tick styles, minor tick styles, and reference line models |
| Y2 (right) axis lines
(axis, grid, tick, and reference lines) |
getY2AxisModel() and use the returned AxisModel to set axis line style, grid line styles, major tick styles, minor tick styles, and reference line models |
| legend frame | getLineLegendModel().setFrameLineStyle(LineStyle) |
| missing-values lines | getDataElementStyles().setMissingLineStyle(StrokeLineStyle) |
| error-value lines | getDataElementStyles().setErrorLineStyles(StrokeLineStyle[] ) |
| column axis lines (available when ColumnVariable role is used) |
getColumnAxisModel().setFrameLineStyle(LineStyle) |
| row axis lines (available when RowVariable role is used) |
getRowAxisModel().setFrameLineStyle(LineStyle) |
| frame lines around column/row cells
(available when ColumnVariable and/or RowVariable roles are used) |
setFrameLineStyle(LineStyle) |
The following code fragment specifies a 3-point blue dashed line:
LinePlotModel graphModel=linePlot.getGraphModel();

StrokeLineStyle[] lineStyles=new StrokeLineStyle[] {
                  new StrokeLineStyle(StrokeLineStyle.SASGRAPH_LINE03,
                  java.awt.Color.blue,
                  new com.sas.measures.BaseLength(3, "pt"),
                  com.sas.components.GraphConstants.TRUE) };

graphModel.getDataElementStyles().setLineStyles(lineStyles);
When the specifications on the data model generate multiple plot lines, the areas between the lines can be filled by calling the LinePlotModel's setFillAreaEnabled() method with the argument value true.
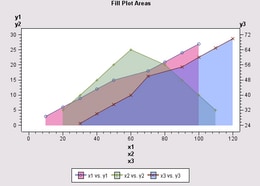
A unique FillStyle is used to fill the area under each plot. To change the fill styles, use the plot's DataElementStyles to set an alternative FillStyle array. The following code fragment creates transparent fills and then assigns them to the plot areas:
LinePlotModel graphModel=linePlot.getGraphModel();
graphModel.setFillAreaEnabled(true);

// Creates new FillStyles. The fourth argument on the
// java.awt.Color constructors is the transparency level
FillStyle[] transparencies=new FillStyle[] {
  new FillStyle(new Color(204,0,102,100) ),    // red transparency
  new FillStyle(new Color(102,153,102,100) ),  // green transparency
  new FillStyle(new Color(51,102,255,100) ) }; // blue transparency

// Assign the fills to the plot's areas (data elements)
graphModel.getDataElementStyles().setFillStyles(transparencies);
You can influence the order in which the filled areas are painted to the screen, depending on how the multiple plots are generated.
If changing the paint order does not provide a satisfactory display of the plot areas, try defining transparent fills for the areas, as shown by the code above.
LinePlotModel properties are bound properties. Modifying a property triggers a PropertyChangeEvent. The LinePlot asynchronously updates when a PropertyChangeEvent is received from the LinePlotModel. Similarly, modifying a property in any of the LinePlotModel's contained models triggers a PropertyChangeEvent. PropertyChangeEvent from contained models will bubble up to cause a PropertyChangeEvent to be fired from the LinePlotModel.
For example, the following call
linePlotModel.getColorLegendModel().getValueTextStyle().setColor(java.awt.Color.yellow);
would cause the legend's value text style model to fire a "color" PropertyChangeEvent, causing legend model to fire a "valueTextStyle" PropertyChangeEvent, causing the LinePlotModel to fire a "colorLegendModel" PropertyChangeEvent. This bubbling up of events enables the graph or any other listener to manage updates at a higher level of containment.