OLAP data structures can be varied and complex. To map an OLAP structure onto a
BIP graph, you can
select measures in the OLAP data
or allow the component's OLAP data model to select measures by default.
The default mapping of data values onto graphical elements
is determined by the dimension and measure specifications defined within
the OLAPDataSetInterface, and also by property settings within the
component's OLAP data model.
- Components that support subgroups have a subgroupEnabled property
that determines whether subgroups are displayed (true by default).
- Components that support data-element fills have a styleByVariable property
that determines whether a fill is used to reflect the values of a measure. For example,
a bar chart can set a styleByVariable so that a different fill is used for each bar.
When fills are used to
represent measure values, the subgroupEnabled property should be set to false.
The following general logic (derived from a more detailed algorithm) is
used for the default mapping of OLAP data values onto graphical elements:
- Get column levels from the OLAP structure (excluding measures).
- Get row levels from the OLAP structure (excluding measures).
- Get measures (they can be on any axis).
- Choose category and subgroup roles for the graph. The model
always chooses these roles
from either the OLAP column or row axis, depending on which axis has the levels to
support them. If neither axis has multiple levels, then the model uses the chosen axis's sole
level for the category role. Here's the general logic:
- If there are any levels on the OLAP column axis, choose the category
and subgroup roles (if supported and enabled) from the column axis.
- If there are no column levels, choose the category and subgroup
roles (if supported and enabled) from the rows axis.
- If the chosen axis has more than one level and the
subgroupEnabled field is true, use
the most detailed axis level for the subgroup role and the next level
for the
category role. If subgroupEnabled is false, use the most detailed level
for the
category role and the next level for the column or row role,
depending on the chosen axis.
- Use all remaining OLAP column levels in the graph column role, and
all remaining OLAP row levels in the graph row role.
- Set response roles, using the measures.
Note. For BarLine components,
the first measure is the bar response and remaining measures are line
responses. For all other chart components, each measure is used as a
separate response.
By default, a graph shows all the measures defined within the OLAPDataSetInterface. If the component
cannot accurately represent the data within the graph display area, it suppresses the graph display
and issues a message. To fix the problem, reduce the amount of data and/or increase
the display area. Alternatively,
select measures from the OLAP model
and set them using the component's API.
For example, a BarChart can set selected measures on the responseVariable and/or response2Variable properties.
Note. Selecting measures can also be useful when the OLAPDataSetInterface is shared across
multiple viewers (where separate viewers may be used to display only portions of the data)
and all viewers can react to actions performed on the one OLAPDataSetInterface.
The following table shows how the default logic is applied for several OLAP data
structures. The table shows a resulting BarChart, but the same logic would be applied
to any of the BIP graph components.
| OLAP Data Structure |
Resulting Graph for a BarChart |
|
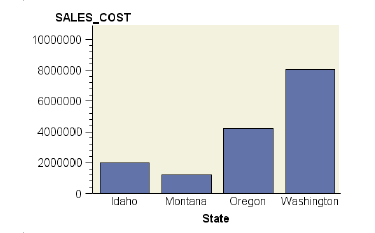
- The OLAP column axis has one level, excluding measures. The one
level, member State, is assigned the category role. There
are no column levels available for a subgroup role.
- There is one measure, SALES_COST, which is assigned the
response role.
|
 |
|
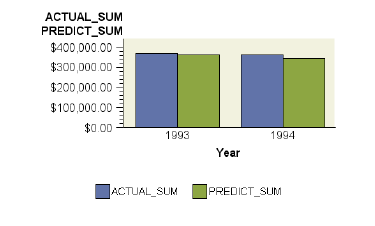
- The OLAP column axis has one level, excluding measures. The one
level, member Year, is assigned the category role. There
are no column levels available for a subgroup role.
- There are two measures, PREDICT_SUM and ACTUAL_SUM. Thus,
each measure is used as a separate response.
|
 |
|
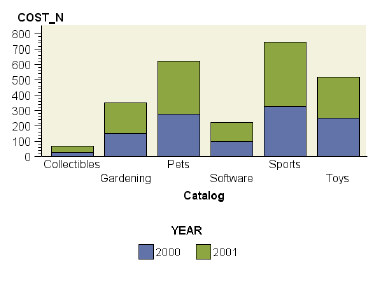
- The OLAP column axis has two levels, excluding measures. The more
detailed level, member Year, is assigned the subgroup role
if subgroupEnabled is true or the column role if subgroupEnabled
is false. The
next level, Catalog, is assigned the category role.
- There is one measure, COST_N, which is assigned the
response role.
|
 |


