<%// ChangeMarker:%>
<%
// A graph's display properties (marker symbol, axis characteristics, and
// so on) are general properties that are defined in the graph's model. The
// marker characteristics are defined as MarkerStyles that are applied to
// the plot's DataElementStyles. Thus, the change the markers,
// 1) Get the ScatterPlot's model
// 2) Define a MarkerStyle for the plot markers
// 3) Set the MarkerStyle on the model's DataElementStyles
%>
<%@page import="
com.sas.servlet.tbeans.graphics.html.ScatterPlot,
com.sas.graphics.components.scatterplot.ScatterPlotModel,
com.sas.graphics.components.MarkerStyle,
com.sas.graphics.components.scatterplot.ScatterPlotTableDataModel,
com.sas.graphics.components.PlotVariable,
com.sas.swing.models.TableModelAdapter,
com.sas.models.SimpleTable,
java.awt.Color"
%>
<%
// Create a ScatterPlot instance
ScatterPlot scatterPlot = new ScatterPlot();
// Create a simple SAS table and add data to it
SimpleTable table = new SimpleTable();
%>
<%@ include file="HeightWeightData.jsp"%>
<%
// Convert a simple SAS table to a simple Java Swing table
TableModelAdapter tma = new TableModelAdapter(table);
tma.setFormattedDataUsed(false);
// Create a data model and attach the data source
ScatterPlotTableDataModel dataModel=
new ScatterPlotTableDataModel(tma);
// 1) Get the ScatterPlot's model
ScatterPlotModel gModel=scatterPlot.getGraphModel();
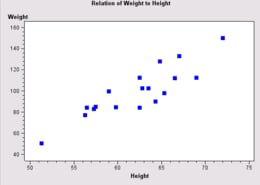
// 2) Define a MarkerStyle for the plot markers
MarkerStyle[] markerStyle=new MarkerStyle[] {
new MarkerStyle(MarkerStyle.SYMBOL_SQUARE_FILLED)};
// 3) Set the MarkerStyle on the model's DataElementStyles
gModel.getDataElementStyles().setMarkerStyles(markerStyle);
// Assign the X and Y variable roles
dataModel.setXVariable(
new PlotVariable("Height"));
dataModel.setYVariable(
new PlotVariable("Weight"));
// Assign the data model to the ScatterPlot
scatterPlot.setDataModel(dataModel);
// Set a graph title and size
scatterPlot.getTitle1().setText(
"Relation of Weight to Height");
scatterPlot.setWidth(400);
scatterPlot.setHeight(300);
// Set HTTP-specific response and request functionality
scatterPlot.setResponse(response);
scatterPlot.setRequest(request);
// Write the plot to the display
scatterPlot.write(out);
%>