<%// SpecifyStatistic:%>
<%
// To specify a statistic, use the AnalysisVariable constructor
%>
<%@page import="com.sas.models.SimpleTable,
com.sas.swing.models.TableModelAdapter,
com.sas.servlet.tbeans.graphics.html.BarLineChart,
com.sas.graphics.components.barlinechart.BarLineChartTableDataModel,
com.sas.graphics.components.AnalysisVariable,
com.sas.graphics.components.ClassificationVariable,
com.sas.graphics.components.GraphConstants"
%>
<%
// Create a BarLineChart instance
BarLineChart barLineChart = new BarLineChart();
// Create a simple SAS table and add data to it
SimpleTable table = new SimpleTable();
%>
<%@ include file="EnergyData.jsp" %>
<%
// Convert a simple SAS table to a simple Java Swing table
TableModelAdapter tma= new TableModelAdapter(table);
tma.setFormattedDataUsed(false);
// Create a data model and attach the data source
BarLineChartTableDataModel dataModel=
new BarLineChartTableDataModel(tma);
// Create the AnalysisVariables and specify statistic
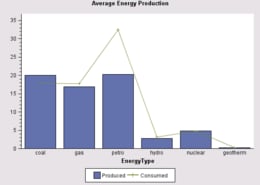
AnalysisVariable produced=new AnalysisVariable(
"Produced" // column for Response role
,GraphConstants.STATISTIC_MEAN // statistic to calculate
);
AnalysisVariable consumed=new AnalysisVariable(
"Consumed" // column for Response role
,GraphConstants.STATISTIC_MEAN // statistic to calculate
);
// Assign the Category variable role, and the
// BarResponse and LineResponse variable roles
dataModel.setCategoryVariable(
new ClassificationVariable("EnergyType"));
dataModel.setBarResponseVariable(
new AnalysisVariable(produced));
dataModel.setLineResponseVariable(
new AnalysisVariable(consumed));
// Assign the data model to the BarLineChart
barLineChart.setDataModel(dataModel);
// Set a graph title
barLineChart.getTitle1().setText("Average Energy Production");
// Set HTTP-specific response and request functionality
barLineChart.setResponse(response);
barLineChart.setRequest(request);
// Write the chart to the display
barLineChart.write(out);
%>