<%// NumericCategoryVar:%>
<%
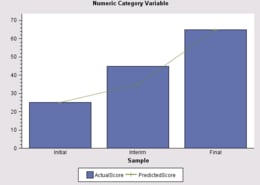
// When using a numeric variable for the Category role, you can define a SAS
// format that categorizes the values for midpointing. Then specify that format
// as an argument on the ClassificationVariable's constructor.
%>
<%@page import="com.sas.models.SimpleTable,
com.sas.swing.models.TableModelAdapter,
com.sas.servlet.tbeans.graphics.html.BarLineChart,
com.sas.text.SASUserDefinedFormat,
com.sas.graphics.components.barlinechart.BarLineChartTableDataModel,
com.sas.graphics.components.AnalysisVariable,
com.sas.graphics.components.ClassificationVariable"
%>
<%
// Create a BarLineChart instance
BarLineChart barLineChart = new BarLineChart();
// Create a simple SAS table and add data to it
SimpleTable table = new SimpleTable();
%>
<%@ include file="ScoreData.jsp" %>
<%
// Convert a simple SAS table to a simple Java Swing table
TableModelAdapter tma= new TableModelAdapter(table);
tma.setFormattedDataUsed(false);
// Create a data model and attach the data source
BarLineChartTableDataModel dataModel=
new BarLineChartTableDataModel(tma);
// Assign a format to numeric variable
ClassificationVariable myFormattedVar=null;
try {
com.sas.text.SASUserDefinedFormat.createFormat(
"value myFormat 1 - 2 = 'Initial'"
+ "3 - 4 = 'Interim'"
+ "5 - 6 = 'Final'");
} catch (java.text.ParseException e) {
java.lang.System.out.println("error=" + e.getMessage());
}
myFormattedVar= new ClassificationVariable("Sample","myFormat");
// Assign the Category variable role, and the
// BarResponse and LineResponse variable roles
dataModel.setCategoryVariable(myFormattedVar);
dataModel.setBarResponseVariable(
new AnalysisVariable("ActualScore"));
dataModel.setLineResponseVariable(
new AnalysisVariable("PredictionScore"));
// Assign the data model to the BarLineChart
barLineChart.setDataModel(dataModel);
// Set a graph title
barLineChart.getTitle1().setText("Numeric Category Variable");
// Set HTTP-specific response and request functionality
barLineChart.setResponse(response);
barLineChart.setRequest(request);
// Write the chart to the display
barLineChart.write(out);
%>