// SpecifyRows:
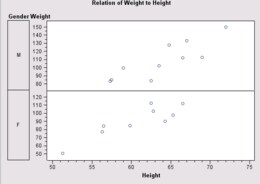
// To generate a scatter plot for each value of a categorical variable
// and align the plots vertically, assign the Row variable role
// to an appropriate categorical variable. To improve the plot
// appearance, you may need to modify tick display on the Y axis.

   import com.sas.graphics.components.scatterplot.ScatterPlot;
   import com.sas.graphics.components.scatterplot.ScatterPlotModel;
   import com.sas.graphics.components.scatterplot.ScatterPlotTableDataModel;
   import com.sas.graphics.components.PlotVariable;
   import com.sas.graphics.components.ClassificationVariable;
   import com.sas.graphics.components.AxisModel;
   import java.awt.BorderLayout;
   import java.awt.Color;
   import java.awt.Container;
   import java.awt.event.WindowAdapter;
   import java.awt.event.WindowEvent;
   import javax.swing.JFrame;
   import javax.swing.JPanel;
   import javax.swing.table.DefaultTableModel;

   public class SpecifyRows extends JPanel  {
     private SpecifyRows  theApp;
     public SpecifyRows () {
        setLayout(new BorderLayout());

     // Create a ScatterPlot and a data source
        ScatterPlot scatterPlot=new ScatterPlot();
        SampleData dataTable=new SampleData();

     // Create a data model and attach the data source
        ScatterPlotTableDataModel dataModel=
                  new ScatterPlotTableDataModel();
        dataModel.setModel(dataTable);

     // Assign the X, Y, and Column variable roles
        dataModel.setXVariable(
                  new PlotVariable("Height"));
        dataModel.setYVariable(
                  new PlotVariable("Weight"));
        dataModel.setRowVariable(
                  new ClassificationVariable("Gender"));

     // Assign the data model to the ScatterPlot
        scatterPlot.setDataModel(dataModel);

     // Modify the Y axis
        ScatterPlotModel graphModel=scatterPlot.getGraphModel();
        AxisModel axisModel = graphModel.getYAxisModel();
        axisModel.setContinuousMajorTickCount(4);
        axisModel.setContinuousMinorTickCount(1);

     // Set a graph title
        scatterPlot.getTitle1().setText(
                  "Relation of Weight to Height");

        add(scatterPlot, BorderLayout.CENTER);
      }
  // Create the data source
     static private class SampleData extends DefaultTableModel {
       private static Class  columnClass[]={
                   String.class, String.class,
                   Double.class, Double.class, Double.class};
       private static String columnNames[]={
                  "Name","Gender","Age","Height","Weight"};
         public SampleData() {
	   super();
           Object data[][] = {
             {"Alfred", "M", new Double(14), new Double(69), new Double(112.5) },
             {"Alice", "F", new Double(13), new Double(56.5), new Double(84) },
             {"Barbara", "F", new Double(13), new Double(65.3), new Double(98) },
             {"Carol", "F", new Double(14), new Double(62.8), new Double(102.5) },
             {"Henry", "M", new Double(14), new Double(63.5), new Double(102.5) },
             {"James", "M", new Double(12), new Double(57.3), new Double(83) },
             {"Jane", "F", new Double(12), new Double(59.8), new Double(84.5) },
             {"Janet", "F", new Double(15), new Double(62.5), new Double(112.5) },
             {"Jeffrey", "M", new Double(13), new Double(62.5), new Double(84) },
             {"John", "M", new Double(12), new Double(59), new Double(99.5) },
             {"Joyce", "F", new Double(11), new Double(51.3), new Double(50.5) },
             {"Judy", "F", new Double(14), new Double(64.3), new Double(90) },
             {"Louise", "F", new Double(12), new Double(56.3), new Double(77) },
             {"Mary", "F", new Double(15), new Double(66.5), new Double(112) },
             {"Philip", "M", new Double(16), new Double(72), new Double(150) },
             {"Robert", "M", new Double(12), new Double(64.8), new Double(128) },
             {"Ronald", "M", new Double(15), new Double(67), new Double(133) },
             {"Thomas", "M", new Double(11), new Double(57.5), new Double(85) },
             {"William", "M", new Double(15), new Double(66.5), new Double(112) }
           };
           setDataVector(data, columnNames);
         }
         public Class getColumnClass(int column) {
           return columnClass[column];
         }
       }
      public static void main(String[] args) {
      	  JFrame frame = new JFrame("BIP Graph Sample");
      	  Container container = frame.getContentPane();
          container.setLayout(new BorderLayout());
          container.setBackground(Color.white);

          JPanel bipPanel = new JPanel();
          bipPanel.setLayout(new BorderLayout());
          SpecifyRows  bipGraphSample = new SpecifyRows ();

          bipPanel.add(bipGraphSample, BorderLayout.CENTER);
          container.add(bipPanel, BorderLayout.CENTER);

          frame.setSize(600,450);
          frame.addWindowListener(new WindowAdapter() {
              public void windowClosing(WindowEvent e) {
                     System.exit(0);
              }
          } );
          frame.setVisible(true);
      }
   }