// MultipleY:
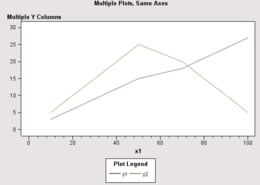
// To plot mutliple Y variables by the same X variable, add the
// Y variables to a PlotVariableList, and then assign the Y role
// to that list rather than to an individual variable.
//
// Optionally, you can modify the Y axis and specify labels.
// This sample also disables markers and enables plot interpolation.

   import com.sas.graphics.components.GraphConstants;
   import com.sas.graphics.components.PlotVariable;
   import com.sas.graphics.components.PlotVariableList;
   import com.sas.graphics.components.scatterplot.ScatterPlot;
   import com.sas.graphics.components.scatterplot.ScatterPlotModel;
   import com.sas.graphics.components.scatterplot.ScatterPlotTableDataModel;
   import java.awt.BorderLayout;
   import java.awt.Color;
   import java.awt.Container;
   import java.awt.event.WindowAdapter;
   import java.awt.event.WindowEvent;
   import javax.swing.JFrame;
   import javax.swing.JPanel;
   import javax.swing.table.DefaultTableModel;

   public class MultipleY extends JPanel  {
     private MultipleY  theApp;
     public MultipleY () {
        setLayout(new BorderLayout());

     // Create a data model and attach the data (defined below)
        ScatterPlotTableDataModel dataModel = null;
        dataModel=new ScatterPlotTableDataModel(new SampleData());

     // Create a scatter plot and get its model
        ScatterPlot scatterPlot=new ScatterPlot(dataModel);
        ScatterPlotModel graphModel=scatterPlot.getGraphModel();

     // Define an X variable
        PlotVariable oneX=new PlotVariable(new PlotVariable("x1"));

     // Define multiple Y variables
        PlotVariableList multiY=new PlotVariableList(
                  new PlotVariable[] {
                      new PlotVariable("y1"),
                      new PlotVariable("y2")
                  } );

     // Assign the X and Y variable roles
        dataModel.setXVariable(oneX);
        dataModel.setYVariable(multiY);

     // Modify the Y axis and specify axis and legend labels
	graphModel.getYAxisModel().setLabel("Multiple Y Columns");
        graphModel.getYAxisModel().getMinorTickStyle().getLineStyle().setVisibilityPolicy(GraphConstants.FALSE);
        graphModel.getColorLegendModel().setLabel("Plot Legend");

     // Disable markers and enable the default interpolation
        graphModel.setMarkerEnabled(false);
        graphModel.setInterpolationEnabled(true);

     // Set a graph title
        scatterPlot.getTitle1().setText(
                 "Multiple Plots, Same Axes");

        add(scatterPlot, BorderLayout.CENTER);
      }
  // Create the data source
     static private class SampleData extends DefaultTableModel {
       private static Class  columnClass[]={ Double.class
                                            , Double.class
                                            , Double.class
                                            , Double.class
                                            , Double.class
                                            , Double.class
                                            };

        private static String columnNames[]={ "x1"
                                            , "x2"
                                            , "x3"
                                            , "y1"
                                            , "y2"
                                            , "y3"
                                            };

	    public SampleData()
	    {
	        super();
            Object data[][]={
                              {new Double( 10),new Double( 20), new Double( 30), new Double(  3),new Double(  5), new Double(  25)}
                            , {new Double( 20),new Double( 30), new Double( 40), new Double(  6),new Double(  10), new Double(  30)}
                            , {new Double( 30),new Double( 40), new Double( 50), new Double(  9),new Double(  15), new Double(  35)}
                            , {new Double( 40),new Double( 50), new Double( 60), new Double(  12),new Double(  20), new Double(  40)}
                            , {new Double( 50),new Double( 60), new Double( 70), new Double(  15),new Double(  25), new Double(  50)}
                            , {new Double( 70),new Double( 80), new Double( 90), new Double(  18),new Double( 20), new Double(  55)}
                            , {new Double( 80),new Double( 90), new Double( 100), new Double(  21),new Double(  15), new Double(  60)}
                            , {new Double( 90),new Double( 100), new Double( 110), new Double(  24),new Double(  10), new Double(  65)}
                            , {new Double( 100),new Double( 110), new Double( 120), new Double(  27),new Double(  5), new Double(  70)}
                            };
            setDataVector(data, columnNames);
	    }

	    public Class getColumnClass(int column)
	    {
	    	return columnClass[column];
	    }
        }
      public static void main(String[] args) {
      	  JFrame frame = new JFrame("BIP Graph Sample");
      	  Container container = frame.getContentPane();
          container.setLayout(new BorderLayout());
          container.setBackground(Color.white);

          JPanel bipPanel = new JPanel();
          bipPanel.setLayout(new BorderLayout());
          MultipleY  bipGraphSample = new MultipleY ();

          bipPanel.add(bipGraphSample, BorderLayout.CENTER);
          container.add(bipPanel, BorderLayout.CENTER);

          frame.setSize(600,450);
          frame.addWindowListener(new WindowAdapter() {
              public void windowClosing(WindowEvent e) {
                     System.exit(0);
              }
          } );
          frame.setVisible(true);
      }
   }