// SpecifyStatistic:
// To specify a statistic, use the AnalysisVariable constructor
import com.sas.graphics.components.barlinechart.BarLineChart;
import com.sas.graphics.components.barlinechart.BarLineChartTableDataModel;
import com.sas.graphics.components.AnalysisVariable;
import com.sas.graphics.components.ClassificationVariable;
import com.sas.graphics.components.GraphConstants;
import java.awt.BorderLayout;
import java.awt.Color;
import java.awt.Container;
import java.awt.event.WindowAdapter;
import java.awt.event.WindowEvent;
import javax.swing.JFrame;
import javax.swing.JPanel;
import javax.swing.table.DefaultTableModel;
public class SpecifyStatistic extends JPanel {
private SpecifyStatistic theApp;
public SpecifyStatistic () {
setLayout(new BorderLayout());
// Create a data model and attach the data (defined below)
BarLineChartTableDataModel dataModel = null;
dataModel=new BarLineChartTableDataModel(new SampleData());
// Create the AnalysisVariables and specify statistic
AnalysisVariable produced=new AnalysisVariable(
"Produced" // column for Response role
,GraphConstants.STATISTIC_MEAN // statistic to calculate
);
AnalysisVariable consumed=new AnalysisVariable(
"Consumed" // column for Response role
,GraphConstants.STATISTIC_MEAN // statistic to calculate
);
// Assign the Category variable role, and the
// BarResponse and LineResponse variable roles
dataModel.setCategoryVariable(
new ClassificationVariable("EnergyType"));
dataModel.setBarResponseVariable(
new AnalysisVariable(produced));
dataModel.setLineResponseVariable(
new AnalysisVariable(consumed));
// Create a BarLineChart and assign its data model
BarLineChart barLineChart=new BarLineChart();
barLineChart.setDataModel(dataModel);
// Set a graph title
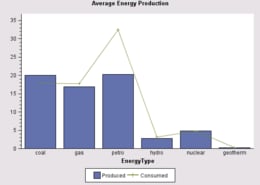
barLineChart.getTitle1().setText("Average Energy Production");
add(barLineChart, BorderLayout.CENTER);
}
// Create the data source
static private class SampleData extends DefaultTableModel {
private static Class columnClass[]={String.class, String.class,
Double.class, Double.class};
private static String columnNames[]={"EnergyType","Year","Produced","Consumed"};
public SampleData() {
super();
Object data[][] = {
{"coal", "1985", new Double(19.33), new Double(17.48) },
{"gas", "1985", new Double(16.92), new Double(17.85) },
{"petro", "1985", new Double(21.23), new Double(30.92) },
{"hydro", "1985", new Double(2.94), new Double(3.36) },
{"nuclear", "1985", new Double(4.15), new Double(4.15) },
{"geotherm", "1985", new Double(0.20), new Double(0.20) },
{"coal", "1986", new Double(19.51), new Double(17.26) },
{"gas", "1986", new Double(16.47), new Double(16.71) },
{"petro", "1986", new Double(20.53), new Double(32.20) },
{"hydro", "1986", new Double(3.03), new Double(3.40) },
{"nuclear", "1986", new Double(4.47), new Double(4.47) },
{"geotherm", "1986", new Double(0.22), new Double(0.22) },
{"coal", "1987", new Double(20.14), new Double(18.01) },
{"gas", "1987", new Double(17.05), new Double(17.67) },
{"petro", "1987", new Double(19.89), new Double(32.87) },
{"hydro", "1987", new Double(2.59), new Double(3.07) },
{"nuclear", "1987", new Double(4.91), new Double(4.91) },
{"geotherm", "1987", new Double(0.23), new Double(0.23) },
{"coal", "1988", new Double(20.94), new Double(18.81) },
{"gas", "1988", new Double(17.19), new Double(18.60) },
{"petro", "1988", new Double(19.52), new Double(33.96) },
{"hydro", "1988", new Double(2.32), new Double(2.62) },
{"nuclear", "1988", new Double(5.68), new Double(5.68) },
{"geotherm", "1988", new Double(0.22), new Double(0.22) }
};
setDataVector(data, columnNames);
}
public Class getColumnClass(int column) {
return columnClass[column];
}
}
public static void main(String[] args) {
JFrame frame = new JFrame("BIP Graph Sample");
Container container = frame.getContentPane();
container.setLayout(new BorderLayout());
container.setBackground(Color.white);
JPanel bipPanel = new JPanel();
bipPanel.setLayout(new BorderLayout());
SpecifyStatistic bipGraphSample = new SpecifyStatistic ();
bipPanel.add(bipGraphSample, BorderLayout.CENTER);
container.add(bipPanel, BorderLayout.CENTER);
frame.setSize(600,450);
frame.addWindowListener(new WindowAdapter() {
public void windowClosing(WindowEvent e) {
System.exit(0);
}
} );
frame.setVisible(true);
}
}