Sample 59710: Handling Spatial Data in Spherical Coordinates
 |  |  |  |
Overview
PROC SPP and other spatial analysis procedures in SAS/STAT are designed to handle projected coordinate systems, where the distance between two points can be computed using the Euclidean formula,
![]() . If your data are collected in a spherical coordinate system—for example, longitude and latitude—then you should convert it to a projected system before applying PROC SPP. This example walks you through a sequence of steps that demonstrate how to handle data that have spherical coordinates in order to analyze them by using PROC SPP.
. If your data are collected in a spherical coordinate system—for example, longitude and latitude—then you should convert it to a projected system before applying PROC SPP. This example walks you through a sequence of steps that demonstrate how to handle data that have spherical coordinates in order to analyze them by using PROC SPP.
Example
You are a geologist studying the relationship between the locations of earthquakes and the locations of geothermal activity in the western United States. You have earthquake data, courtesy of the United States Geological Service (USGS) and data about hot springs, courtesy of the National Oceanic and Atmospheric Administration (NOAA).
The Earthquakes data set is the collection of earthquakes with magnitude greater than 2.5 (on the Richter scale) in the continental United States collected from 2005 to 2015. In addition to the latitude and longitude of the epicenter of each earthquake, the data include other attributes, such as the earthquake’s magnitude. The following DATA step reads the data and creates the data set Earthquakes:
data earthquakes;
  length Type $ 10;
  infile "https://support.sas.com/rnd/app/data/earthquakes.txt" url;
  input Latitude Longitude Depth Magnitude dNearestStation
        RootMeanSquareTime Type $;
  run;
The Hotsprings data set is the collection of hot spring locations in the continental United States. Again, along with the latitude and longitude of each hot spring, the data include other attributes, such as its temperature and popular name. The following DATA step reads the data and creates the data set Hotsprings:
data hotsprings;
  length Type $ 10;
  infile "https://support.sas.com/rnd/app/data/hotsprings.txt" url;
  input Latitude 1-6 Longitude 8-15 TemperatureFarenheit $ 17-19
        TemperatureCelsius $ 21-23;
  Type = "hotspring";
  run;
You can view both of the data sets as spatial point patterns that are given in spherical coordinates. To explore whether the locations of hot springs and earthquakes are correlated, you first merge the two data sets into a single marked spatial point pattern, with a type variable to denote an earthquake, explosion, landslide, or hot spring, as shown in the following code.
data QuakesAndSprings;
   set earthquakes hotsprings;
   where (type in ('hotspring','earthquake'));
run;
The combined data set, QuakesAndSprings, contains locations in spherical coordinates, given as Longitude and Latitude. You can use the GPROJECT procedure in SAS/GRAPH® to transform these spherical coordinates to projected coordinates. PROC GPROJECT requires that the data have an identification variable and that the spherical coordinates be named X and Y, respectively. The following statements prepare the data, apply PROC GPROJECT, and then prepare the resulting projected data for analysis by PROC SPP:
data GProjectIn;
   set QuakesAndSprings;
   ID = _N_;
   rename latitude=y longitude=x;
run;

proc gproject data=GProjectIn out=GProjectOut degrees;
   id ID;
run;

data GProjectOut;
   set GProjectOut;
   format _character_;
   informat _character_;
run;
The resulting data set, GProjectOut, contains the data in projected coordinates. In this form, you can use the projected data with PROC SPP to analyze the relationship between earthquakes and hot springs by using the following statements
 ods graphics on;
 proc spp data=GProjectOut plots(unpack)=(all observ(attr=mark));
    process p = (X,Y / mark=type)
                / G cross=types('hotspring','earthquake') maxdist=max;
 run;
Figure 1: Projected locations of earthquakes and hot springs
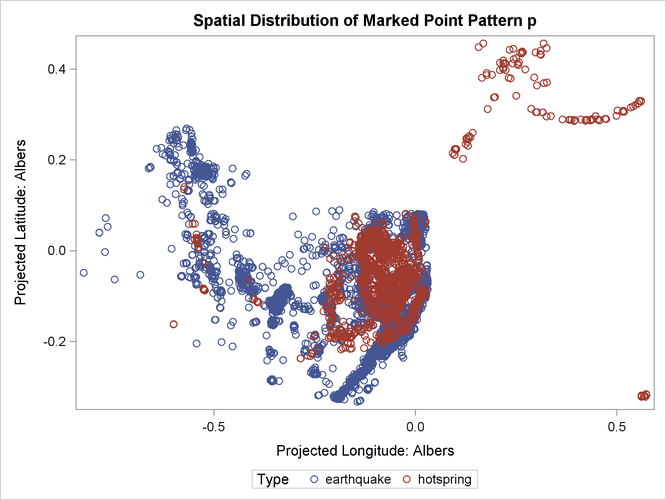
Figure 1 shows the locations of earthquakes, hot springs, landslides and explosions of different kinds.
Figure 2: Cross G-function between Hot Spring and Earthquake
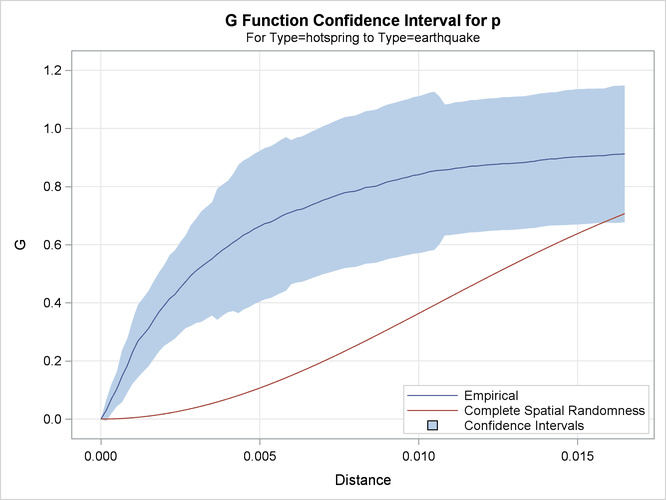
Figure 2 shows the plot of the edge-corrected cross G-function computed between earthquakes and hot springs. The blue line, which represents the empirical cross G-function, is far above the dashed red line. The confidence interval of the cross G-function is shown by the blue band around the blue line, also does not intersect with the dashed red line. This suggests that earthquakes are indeed clustered around hot spring locations.
These sample files and code examples are provided by SAS Institute Inc. "as is" without warranty of any kind, either express or implied, including but not limited to the implied warranties of merchantability and fitness for a particular purpose. Recipients acknowledge and agree that SAS Institute shall not be liable for any damages whatsoever arising out of their use of this material. In addition, SAS Institute will provide no support for the materials contained herein.
data earthquakes;
  length Type $ 10;
  infile "https://support.sas.com/rnd/app/data/earthquakes.txt" url;
  input Latitude Longitude Depth Magnitude dNearestStation
        RootMeanSquareTime Type $;
  run;


data hotsprings;
  length Type $ 10;
  infile "https://support.sas.com/rnd/app/data/hotsprings.txt" url;
  input Latitude 1-6 Longitude 8-15 TemperatureFarenheit $ 17-19
        TemperatureCelsius $ 21-23;
  Type = "hotspring";
  run;


data QuakesAndSprings;
   set earthquakes hotsprings;
   where (type in ('hotspring','earthquake'));
run;


data GProjectIn;
   set QuakesAndSprings;
   ID = _N_;
   rename latitude=y longitude=x;
run;

proc gproject data=GProjectIn out=GProjectOut degrees;
   id ID;
run;

data GProjectOut;
   set GProjectOut;
   format _character_;
   informat _character_;
run;


 ods graphics on;
 proc spp data=GProjectOut plots(unpack)=(all observ(attr=mark));
    process p = (X,Y / mark=type)
                / G cross=types('hotspring','earthquake') maxdist=max;
 run;
These sample files and code examples are provided by SAS Institute Inc. "as is" without warranty of any kind, either express or implied, including but not limited to the implied warranties of merchantability and fitness for a particular purpose. Recipients acknowledge and agree that SAS Institute shall not be liable for any damages whatsoever arising out of their use of this material. In addition, SAS Institute will provide no support for the materials contained herein.
| Type: | Sample |
| Topic: | SAS Reference ==> Procedures ==> SPP Analytics ==> Spatial Analysis |
| Date Modified: | 2017-01-18 09:39:49 |
| Date Created: | 2017-01-17 10:34:11 |
Operating System and Release Information
| Product Family | Product | Host | SAS Release | |
| Starting | Ending | |||
| SAS System | SAS/STAT | z/OS | ||
| z/OS 64-bit | ||||
| OpenVMS VAX | ||||
| Microsoft® Windows® for 64-Bit Itanium-based Systems | ||||
| Microsoft Windows Server 2003 Datacenter 64-bit Edition | ||||
| Microsoft Windows Server 2003 Enterprise 64-bit Edition | ||||
| Microsoft Windows XP 64-bit Edition | ||||
| Microsoft® Windows® for x64 | ||||
| OS/2 | ||||
| Microsoft Windows 8 Enterprise 32-bit | ||||
| Microsoft Windows 8 Enterprise x64 | ||||
| Microsoft Windows 8 Pro 32-bit | ||||
| Microsoft Windows 8 Pro x64 | ||||
| Microsoft Windows 8.1 Enterprise 32-bit | ||||
| Microsoft Windows 8.1 Enterprise x64 | ||||
| Microsoft Windows 8.1 Pro 32-bit | ||||
| Microsoft Windows 8.1 Pro x64 | ||||
| Microsoft Windows 10 | ||||
| Microsoft Windows 95/98 | ||||
| Microsoft Windows 2000 Advanced Server | ||||
| Microsoft Windows 2000 Datacenter Server | ||||
| Microsoft Windows 2000 Server | ||||
| Microsoft Windows 2000 Professional | ||||
| Microsoft Windows NT Workstation | ||||
| Microsoft Windows Server 2003 Datacenter Edition | ||||
| Microsoft Windows Server 2003 Enterprise Edition | ||||
| Microsoft Windows Server 2003 Standard Edition | ||||
| Microsoft Windows Server 2003 for x64 | ||||
| Microsoft Windows Server 2008 | ||||
| Microsoft Windows Server 2008 R2 | ||||
| Microsoft Windows Server 2008 for x64 | ||||
| Microsoft Windows Server 2012 Datacenter | ||||
| Microsoft Windows Server 2012 R2 Datacenter | ||||
| Microsoft Windows Server 2012 R2 Std | ||||
| Microsoft Windows Server 2012 Std | ||||
| Microsoft Windows XP Professional | ||||
| Windows 7 Enterprise 32 bit | ||||
| Windows 7 Enterprise x64 | ||||
| Windows 7 Home Premium 32 bit | ||||
| Windows 7 Home Premium x64 | ||||
| Windows 7 Professional 32 bit | ||||
| Windows 7 Professional x64 | ||||
| Windows 7 Ultimate 32 bit | ||||
| Windows 7 Ultimate x64 | ||||
| Windows Millennium Edition (Me) | ||||
| Windows Vista | ||||
| Windows Vista for x64 | ||||
| 64-bit Enabled AIX | ||||
| 64-bit Enabled HP-UX | ||||
| 64-bit Enabled Solaris | ||||
| ABI+ for Intel Architecture | ||||
| AIX | ||||
| HP-UX | ||||
| HP-UX IPF | ||||
| IRIX | ||||
| Linux | ||||
| Linux for x64 | ||||
| Linux on Itanium | ||||
| OpenVMS Alpha | ||||
| OpenVMS on HP Integrity | ||||
| Solaris | ||||
| Solaris for x64 | ||||
| Tru64 UNIX | ||||