Sample 53773: Goal-Seeking Forecast with SAS In-Memory Statistics for Hadoop
 |  |  |  |  |  |
The example shows how to use the FORECAST statement of SAS In-Memory Statistics for Hadoop (PROC IMSTAT) to perform goal-seeking forecasting, which is often of interest to business users in real life analysis. The goal-seeking forecasting works such that if you have a desired goal for an analysis variable, such as profits, the FORECAST statement of PROC IMSTAT can calculate and return the values of controllable variables to achieve the goal. For example, if a manager wants to gain a certain amounts of profit (the goal variable) at points in the future, the FORECAST statement can predict values for cost, production, and so on, (the controllable variables) needed to generate the desired profit goal.
When performing goal-seeking forecasting, the FORECAST statement in PROC IMSTAT is capable of automatic model selection and automatic variable selection. The candidate models include smoothing models, ARIMA models, unobserved component models and intermittent demand models.
The example uses a data set, megacorp1m_goal, which is about the operational status of a refinery plant that has three product lines. It includes daily data from all of the plants between 01/01/2001 and 07/31/2011, as well as 10 observations which only have values for the goal variable, profit_goal after the end date 07/31/2011. There are three observations for each date, because each product line provides an observation each day. Goal-seeking forecasting requires the data set to be aggregated by a time or date interval before the server can generate forecasts. For this example, the daily observations are aggregated by date and the example also demonstrates aggregating the data in memory with the AGGREGATE statement of PROC IMSTAT.
These sample files and code examples are provided by SAS Institute Inc. "as is" without warranty of any kind, either express or implied, including but not limited to the implied warranties of merchantability and fitness for a particular purpose. Recipients acknowledge and agree that SAS Institute shall not be liable for any damages whatsoever arising out of their use of this material. In addition, SAS Institute will provide no support for the materials contained herein.
/* Start a LASR Analytic Server */
option set=GRIDHOST="grid001.example.com";
option set=GRIDINSTALLLOC="/opt/TKGrid";
%let myport = 10010;
proc lasr create port=&myport path="/tmp/";
    performance nodes = all;
run;

/* Load the transactional data to memory */
libname hdfs sashdat path="/user/data";
proc lasr add data = hdfs.megacorp1m_goal port=&myport;
    performance nodes = all;
run;

/* Assign a libref to access tables in the server */
libname mylasr sasiola tag='USER.DATA' port=&myport;

/* Start PROC IMSTAT to analyze the data */
proc imstat;
    table mylasr.megacorp1m_goal;
    fetch/format orderby=date from=11583 to=11602;
run;
/* Aggregate the analysis variable, goal variable and controllable variables by day. */
    table mylasr.megacorp1m_goal;
    aggregate profit(aggregator=sum)
              profit_goal(aggregator=sum)
              productactual(aggregator=sum)
              expense(aggregator=sum)
    / id = date interval = 'day.' idformat = 'mmddyy10.' temptable
;
run;
/* Fetch the last 20 observations of the aggregated data. */
/* Promote the aggregated transactional data to use for forecasting. */
    table mylasr.&_templast_;
    fetch/format orderby=date from=3855 to=3874;
    promote megacorp1m_goal_agged;
run;
/* Perform automatic model selection and variablbe selection. */
/* Conduct goal seeking analysis with profit_goal as goal variable, productactual and expense
    as controllable variables*/
    forecast data = mylasr.megacorp1m_goal_agged date /
        vars = (_profit_sum_) info
        goal = _profit_goal_sum_ control = (_productactual_sum_ _expense_sum_);
    ods output forecast = work.forecastresult_goal forecastxvars=work.forecastxvars;
run;
quit;
proc sgplot data=work.forecastresult_goal;
    band x=date lower=lower upper=upper;
    series x=date y=actual/lineattrs=(color=blue);
    series x=date y=predict/lineattrs=(color=red);
    format lower dollar12.
           upper dollar12.
           actual dollar12.
           predict dollar12.
           date mmddyy10.
;
run;

/* Stop the server session */
proc lasr term port = &myport;
run;
These sample files and code examples are provided by SAS Institute Inc. "as is" without warranty of any kind, either express or implied, including but not limited to the implied warranties of merchantability and fitness for a particular purpose. Recipients acknowledge and agree that SAS Institute shall not be liable for any damages whatsoever arising out of their use of this material. In addition, SAS Institute will provide no support for the materials contained herein.
Fetch the last 20 observations of input data set. Note that the goal variable, profit_goal, only have values in the ‘future’.Fetch the last 20 observations of aggregated data set by date.
Auto-selected Model Information. The table is requested by INFO option.
Goal-seeking Analysis Forecast Result
< … and so on … >
Goal-seeking Analysis Controllable Variable Result. The expense level need to be controlled at to get the desired profitability.
< … and so on … >
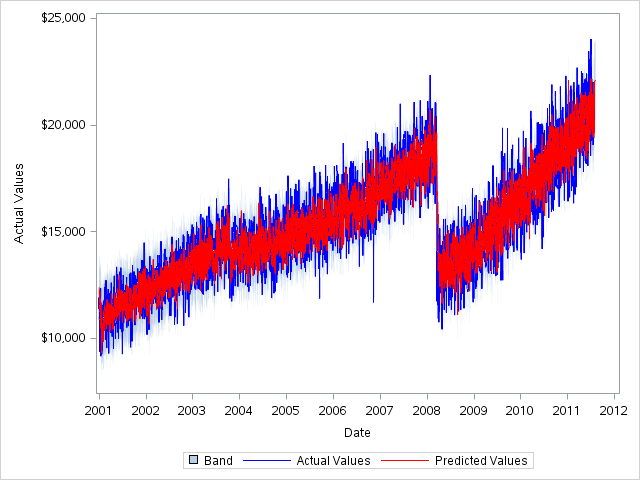
Forecast Plot
Click here to download the data set.
| Type: | Sample |
| Topic: | Analytics ==> Econometrics Analytics ==> Forecasting Analytics ==> Time Series Analysis |
| Date Modified: | 2014-08-14 09:44:09 |
| Date Created: | 2014-07-29 10:22:38 |
Operating System and Release Information
| Product Family | Product | Host | Product Release | SAS Release | ||
| Starting | Ending | Starting | Ending | |||
| SAS System | SAS In-Memory Statistics for Hadoop | Microsoft® Windows® for x64 | 2.2 | 9.4 TS1M2 | ||
| Linux for x64 | 2.2 | 9.4 TS1M2 | ||||
| 64-bit Enabled AIX | 2.2 | 9.4 TS1M2 | ||||
| 64-bit Enabled Solaris | 2.2 | 9.4 TS1M2 | ||||
| Solaris for x64 | 2.2 | 9.4 TS1M2 | ||||
| SAS System | SAS LASR Analytic Server | Microsoft® Windows® for x64 | 2.3_M1 | 9.4 TS1M2 | ||
| 64-bit Enabled AIX | 2.3_M1 | 9.4 TS1M2 | ||||
| 64-bit Enabled Solaris | 2.3_M1 | 9.4 TS1M2 | ||||
| Linux for x64 | 2.3_M1 | 9.4 TS1M2 | ||||
| Solaris for x64 | 2.3_M1 | 9.4 TS1M2 | ||||