Usage Note 53379: BI Reports Overview
 |  |  |
BI Reports – An Overview
Table Of Contents
- Introduction
- Overview
- Filters
- Constructing A Report
- Graphs & Charts
- Exporting, Mailing, & Scheduling Reports
- User Defined Fields
- Helpful Hints
The BI (or Business Intelligence) reporting system is a powerful and extensive report builder with access to a large configurable data set that can help analyze both historical and future (projected) data. The reporting tool itself is called the Analyzer. Unlike operational reports which contain near real-time data, BI data is a day behind.
To access BI, go to the Reports tab and then click the BI Reports tab.
A window will appear with a list of reports or "views":
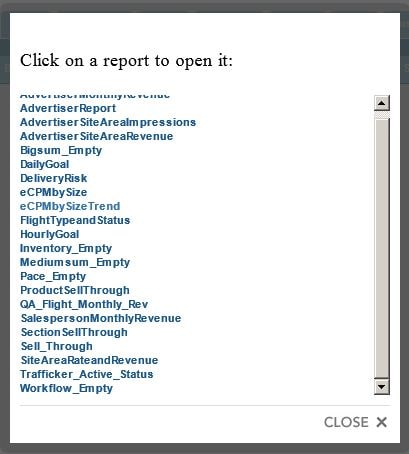
Each report uses a specific data cube which dictates what data is accessible to the Analyzer. The data cubes are accessible through five "empty" reports that all other reports are based on:
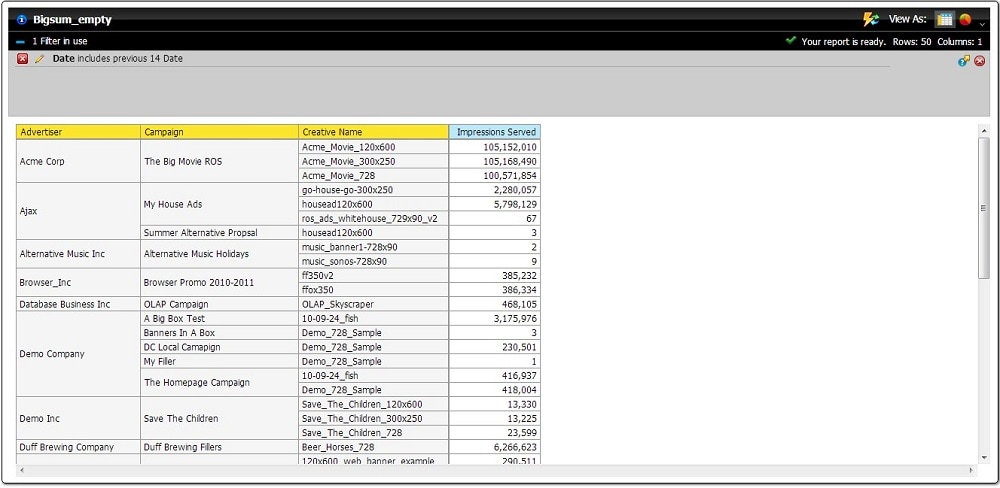
Bigsum_empty – This cube contains historical logging data down to the creative level. Tags and geotargeting tags can also be included in the cube. If a tag needs to be added to this cube, contact Support.
Flights_empty – This cube contains non-delivery flight data. There is no date data or tag data in the cube. The cube can be used to report on flight attributes like impression goals, start and end dates, etc.
Inventory_empty – This cube contains simulated (projected) data for future dates. Like Bigsum, it also contains data down to the creative level and can include tags. By default, dates up to 3 months in the future can be selected.
Mediumsum_empty – This cube contains historical data down to the creative level, along with site and area tags. This is a much smaller cube and generally has a much faster processing time than Bigsum. For most historical reporting, this is the cube that should be used.
Pace_empty – Like Mediumsum, except this cube also contains time of day data. This means delivery by time of day down to the hour can be seen for individual flights.
Workflow_empty – Unlike the other data cubes, this one does not contain any delivery data. It is used to access the sales workflow data to construct reports showing proposals and line items.
Overview [back to top]
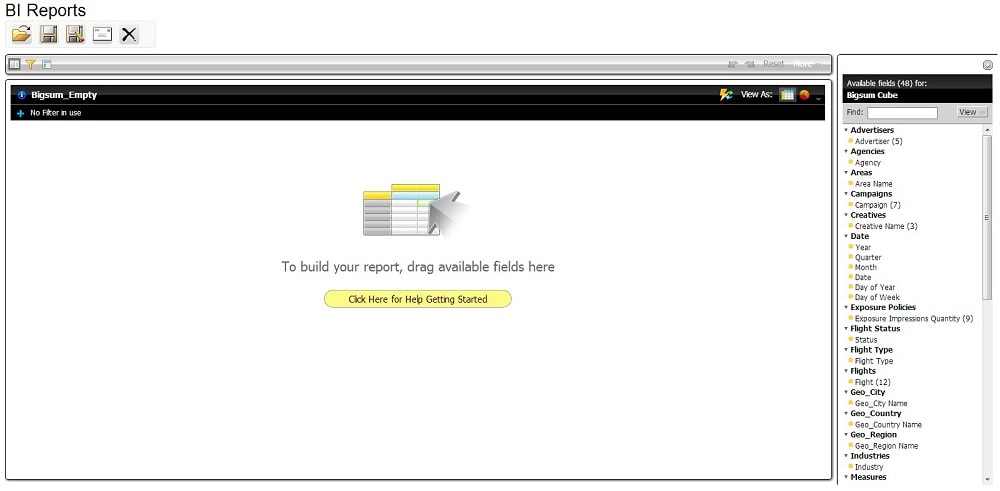
After selecting a report, the main report screen will show. The buttons at the top are operational in nature and allow opening, saving, etc of reports. Do not save over any reports with "_empty" in the name! These are base reports, and "Save As" should always be used when these are being worked with.
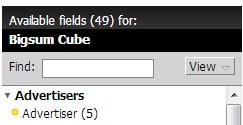
The column on the right contains a list of available fields that can be used as columns or filters in the report. The fields are broken down by section. Fields contain everything from campaign and flight information to tags that have been setup for BI logging. Fields with a number in parentheses indicate additional properties that can be displayed once the field is added to the report. The Measures section contains count data fields like Impressions Served.
Filters [back to top]
Filters restrict the data set to show the desired information. The fields on the right can be used as filters. Click the plus (+) icon next to "No Filter in use" under the cube name at the top.
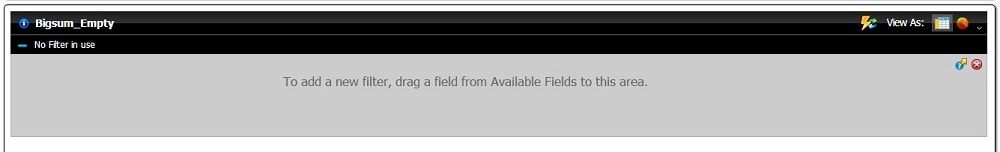
Fields can be dragged and dropped into this expanded area. For example, the "Date" field can be dragged and dropped there. Once dropped, a window will open:
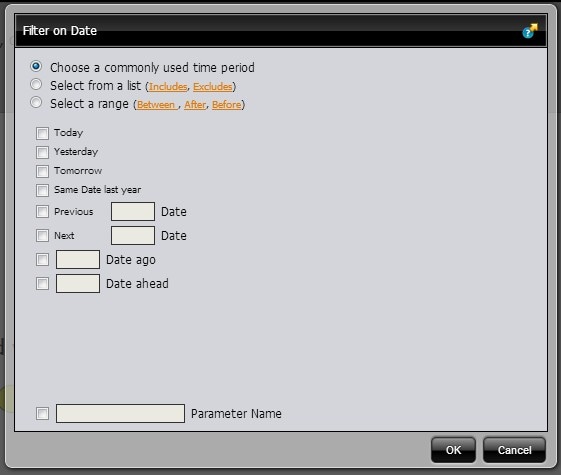
There are 3 date options available: Time period, List, and Range. Time Period (shown above) is the quickest and easiest way of quickly selecting a recent date period.
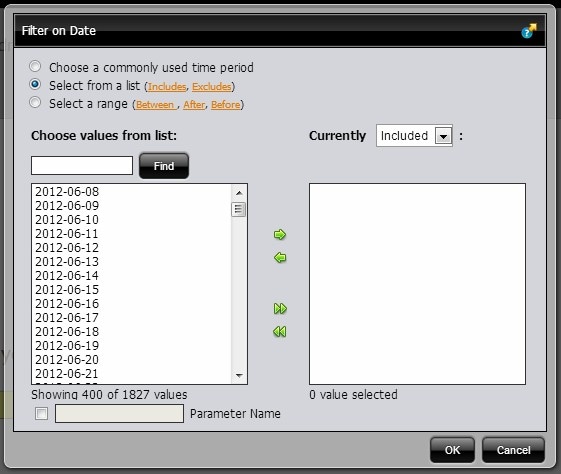
Choosing "Select from a list" will display a list of dates that can be searched. Note the text "Showing 400 of 1827 values". This indicates that the list of values exceeds how many can be shown at once. The search box above the list of values can be utilized to narrow the list down to the desired values. For instance, searching for "2013-04" would show a list of values containing "2013-04" (all of April 2013).
Range filtering allows a beginning and end date to be specified.
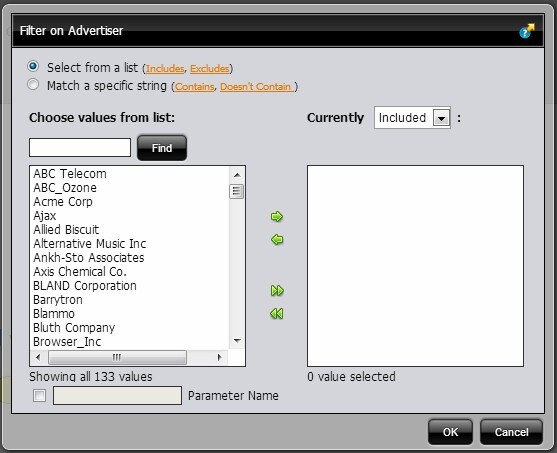
Dragging a standard field into the filter area allows selecting of explicit values.
Multiple values in a row can be selected by clicking a value, holding down shift, and clicking the last value. Or, multiple values can be selected by clicking a value, holding down ctrl, and clicking each desired value. Once the values have been selected, press the > button which will move them to the selected values box to the right. If all the values need to be selected, press the >> button. The < and << buttons move them back to the unselected box.
By default, values moved to the right box will be treated as "included". This means that the report will only show data containing these values. The dropdown menu next to "Currently" above the right box also allows "Excluded" to be selected. If this is chosen, only data without these values will be shown in the report.
Finally, the radio buttons at the top of the window determine where individual values are selected (Select from a list), or values are selected based on a string (Match a specific string). If the latter is selected, entering "2012" would filter on all dates containing "2012".
Most fields can be used as filters, but for dates specifically it is recommended to use the "Date" field rather than "Month" for filtering.
Once values are chosen, click OK and the filter is now active.
Constructing A Report [back to top]
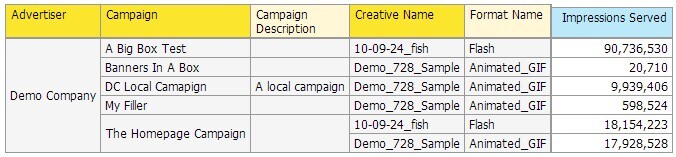
Once the desired filters are setup, fields can be dragged and dropped into the main report area as columns. Measures can generally only be placed as the right most columns:
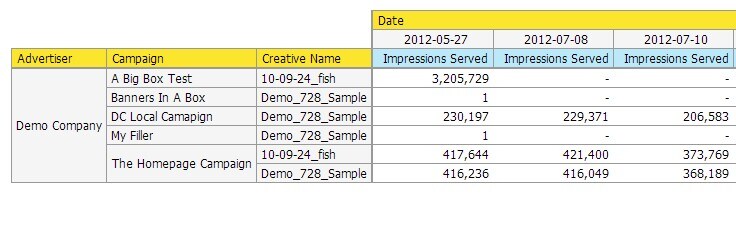
Fields can also be placed above Measure columns:
If a change is made to the report that needs to be undone, click the blue left arrow in the upper right hand part of the BI screen:
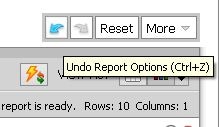
This is also useful if adding a column or filter has resulted in an error. Changes can be redone by clicking the blue right arrow.
Properties
Properties contain additional data related to a field. Fields that have a number inside parentheses in the field list indicate that there are available properties:
For example, the Advertiser field header can be right-clicked in the report view, and the Show Properties menu can be opened:
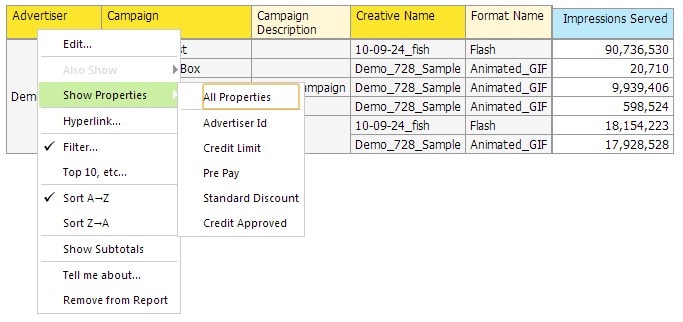
Properties can be enabled which will appear as additional columns with a light yellow background. Unlike fields, properties cannot be used as filters and cannot be rearranged in the column order.
Additional Options
Each column can be right-clicked showing a menu with additional options. Fields and measures will have different options available:
Measures:
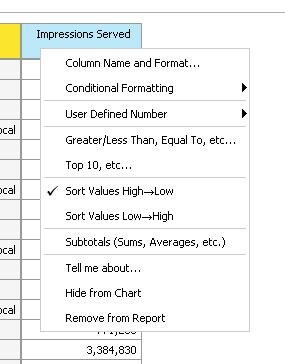
- Column Name and Format – Allows the column name to be customized and the unit to be modified
- Conditional Formatting – Enables graphics and icons visualizing data amounts and trends
- User Defined Number – Creates a new field. See "User Defined Fields" section
- Greater/Less Than, Equal To – Allows additional filters to be specified for the measure
- Top 10 – Allows results to be filtered by Top #. For example, the results could be narrowed down to the top 3 dates with the highest impressions served amounts
- Sort Values – Allows the values to be sorted either highest to lowest, or lowest to highest
- Subtotals – Different types of subtotals can be enabled for the column
Fields:
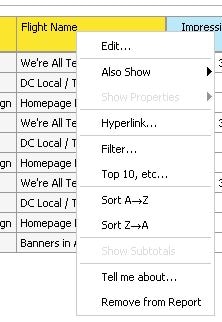
- Edit – Allows the column name to be customized
- Also Show – Lists related fields that can be added to the report view
- Hyperlink – Not used
- Filter – Allows additional filters to be specified for the column
- Top 10 -- Allows results to be filtered by Top #
- Sort – Allows the values to be sorted alphabetically from A to Z, or Z to A.
Column Totals
Column totals can be enabled by clicking the More button located in the upper right part of the BI screen:
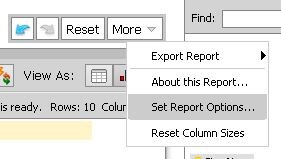
Select "Set Report Options". Enable the "Show Grand Totals for Columns" option, and this will show totals for all the Measure fields added to the report.
Graphs & Charts [back to top]
BI also generates graphs and charts from report data. Select the graph icon next to "View As":
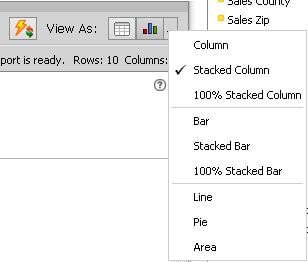
Measures are always placed on the vertical Y-axis, while regular fields are placed on the horizontal X-axis. Filters and fields can still be added and modified while in the graph mode. To switch back to the regular view, select the Table icon next to the Graph icon.
Exporting, Mailing, & Scheduling Reports [back to top]
Reports can be exported by clicking the More button in the upper right part of the BI screen. The Export Report submenu allows PDF, Excel, and CSV conversion.
Reports can also be emailed, but the report has to be saved first. Remember to "Save As" if a "_empty" report was opened first. Click the Email button at the top of the screen, select the report, file type, and enter email address.
To schedule BI reports, set up the fields as they would be have the report emailed but also enter in the scheduling options: Daily, Weekly, or Monthly, and the time the report should start running. Be aware that scheduling multiple reports to run simultaneously can result in the failure of some or all reports to complete running or be emailed. Previously scheduled reports can be accessed by clicking the Manage Schedules button. Note that the report execution time selected reflects the timezone setting of the user's login, which is defined in the UX Admin section.
Reports which exceed 100,000 rows will not be sent.
User Defined Fields [back to top]
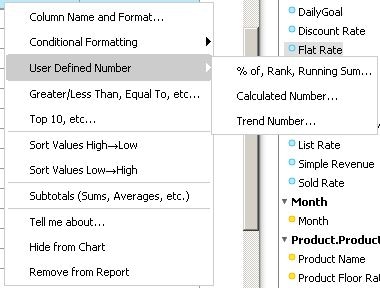
User defined fields are custom calculations that can be created and defined in the Analyzer. Right click on a measure (i.e. Impressions Served) and select the User Defined Number submenu:
% of, Rank, Running Sum – Predefined calculations can be selected here:
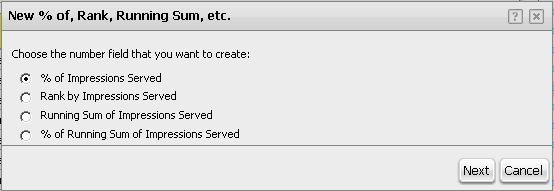
For example, a column showing the numerical rank of each row’s Impressions Served could be created by selecting "Rank by Impressions Served". After pressing Next, change the Name of the column, number format, decimal places, etc, and then press Done. The new column will be created and placed in the Analyzer view.
Calculated Number –
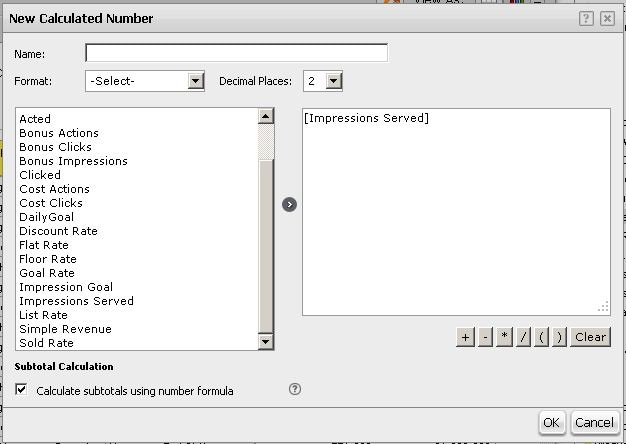
Custom calculations using measures can be constructed here. Available measures are listed in the left section, and the actual calculation is shown in the right section. Each measure will have brackets [ ] surrounding it when placed in the calculation, and a measure can be placed in the calculation by selecting it and pressing the > button, or manually typing the calculation out.
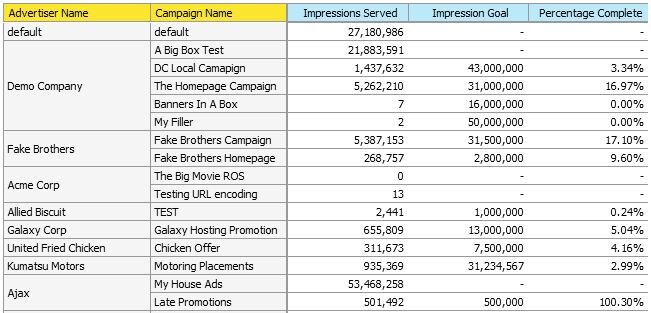
For example, a calculation can be constructed that will show the percentage complete of the impression goal:
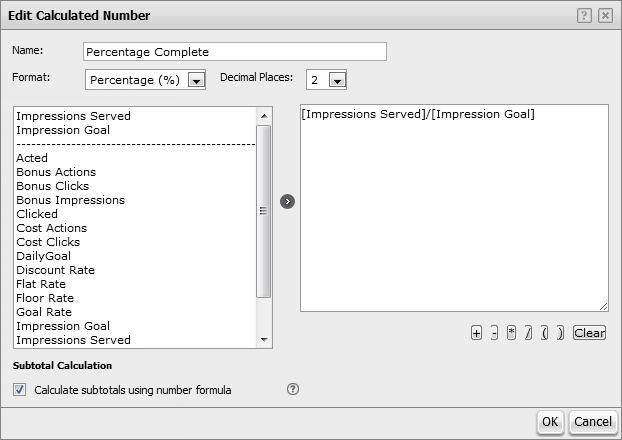
Here the Impressions Served measure is being divided by the Impression Goal. Note that the format above is changed to Percentage. This automatically multiples by 100 and turns the value into a percentage. The field has been named Percentage Complete. Once OK is clicked, the field will be added to the report:
Helpful Hints [back to top]
- Add the filters you need before putting any columns in the report
- Do not save over any of the "_empty" reports!
- The Analyzer can be put into "offline" mode by selecting the "lightning bolt" icon to the left of "View As". This will enable you to setup all the filters and columns before the data is actually pulled from the database. Press it again once everything is setup. This can save some time.
- Try to arrange columns in the correct hierarchical order (i.e. Advertiser fields -> Campaign fields -> Flight fields -> Creative fields)
- Filtering by the Date field instead of the Month field is faster.
- Avoid using "contains" or "Match a specific string" when setting up a filter! This will drastically increase the run time of the report.
- The "contains" filter, when used with multiple values, will only apply the last value in the filter. This is a known issue and it is recommended to select specific values to filter on instead.
Operating System and Release Information
| Product Family | Product | System | SAS Release | |
| Reported | Fixed* | |||
| SAS System | SAS Intelligent Advertising for Publishers | N/A | ||
| Type: | Usage Note |
| Priority: |
| Date Modified: | 2017-09-26 14:12:22 |
| Date Created: | 2014-07-01 14:43:36 |