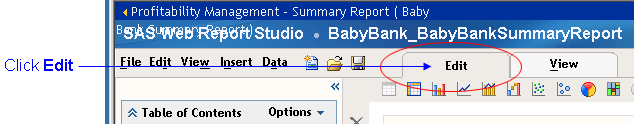
Click the Edit tab.
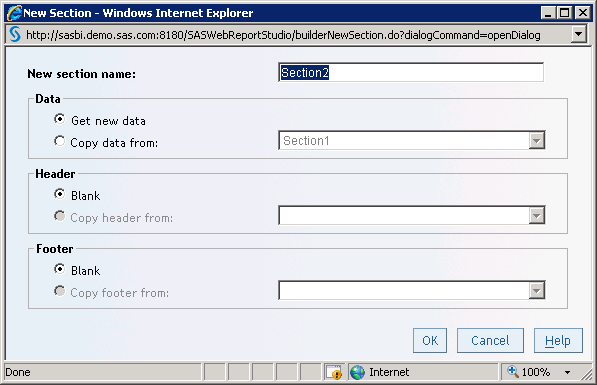
If the current section does not have a place for adding a graph, then click the down arrow under Table of Contents and select Insert a New Section.

The New Section window opens.
Select whether you want to get new data or copy data from a previous section, and then click OK.
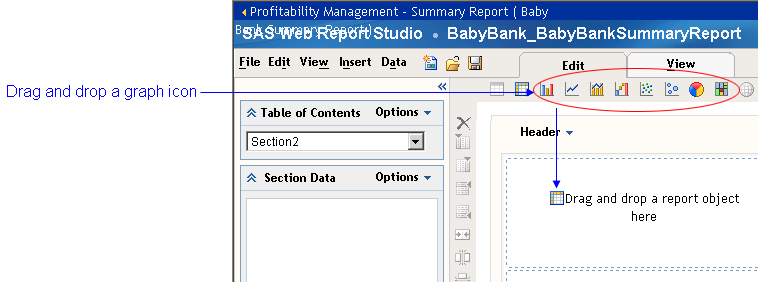
Drag and drop a graph icon onto the layout grid.
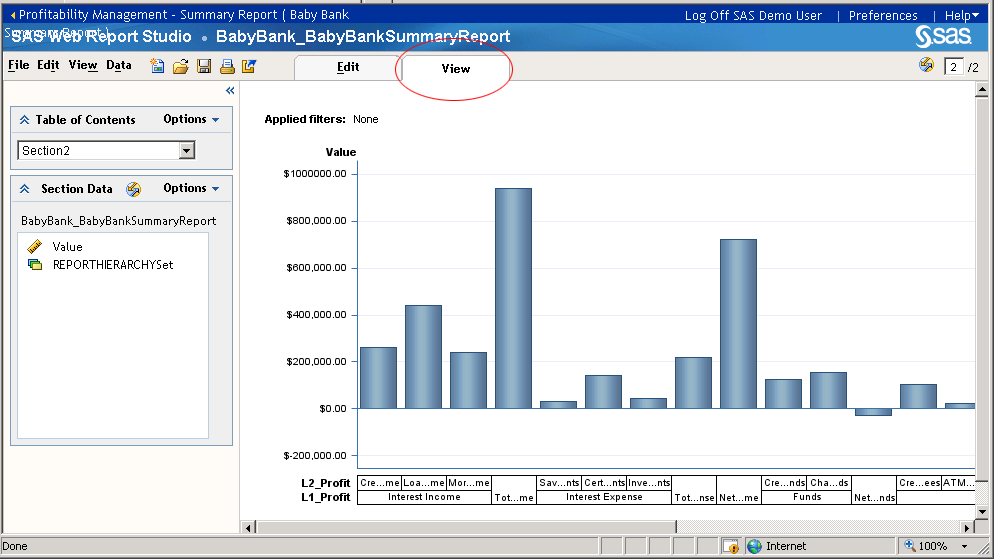
Click the View tab to view the graph.