
|
||
| Overview
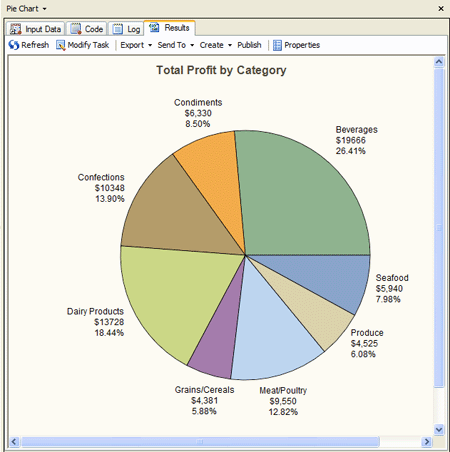
The Pie Chart task creates simple, group, or stacked charts that represent the relative contribution of the parts to the whole by displaying data as slices of a pie. Each slice represents a category of data. The size of a slice represents the contribution of the data to the total chart statistic. You want to create a pie chart that shows the contribution of each product category's profit to the overall profit for the store. You use the Pie Chart task to create the report. |
| Next you start the Pie Chart task, select the type of pie chart, and assign variables to roles. |