
|
||
Overview You have created a report that lists the individual product inventory and the total inventory for each product category. Now let's create a visual report that shows the distribution of inventory across product categories. |
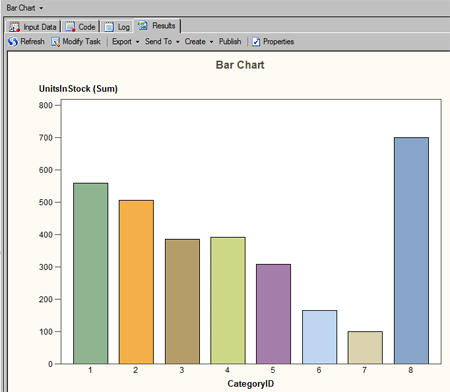
| Next you start the Bar Chart task. |