Performing Redundant Data Analysis
Overview
You can review a database for redundant data for selected fields and tables by running the Redundant Data Analysis riser in a profile report. Then, you can determine how many potentially redundant fields are present in the data. Finally, you can examine the values in those fields and evaluate the data as a candidate for entity resolution.
For example, you could buy a list of names from a list broker to augment your prospect database. Typically, you would send mailings to both lists and hope for the best response. If the same prospects are on both lists, however, it is a waste of money for them to receive mail twice. A redundant data analysis can help you quickly compare the two sources.
You can run redundant data analysis by performing the following tasks:
Prepare and Run a Redundant Data Analysis
You can prepare to run a redundant data analysis in the Redundant Data Analysis riser. Perform the following steps:
- Click inside the riser and click New Redundant Data Analysis in the pop-up menu to display the Redundant Data Analysis Configuration Properties dialog.
- Specify a name and description for the redundant data analysis.
- Select a mode for the analysis. For this example, select Exact, which specifies an exact match between field names. If you prefer, you can select match code and specify to match definition.
- Specify the tables and fields that you want to examine in the analysis. Note that the fields that you select must have a frequency distribution metric enabled. In this case, use address and city fields from two client-oriented tables. The following displays shows the completed configuration properties dialog:
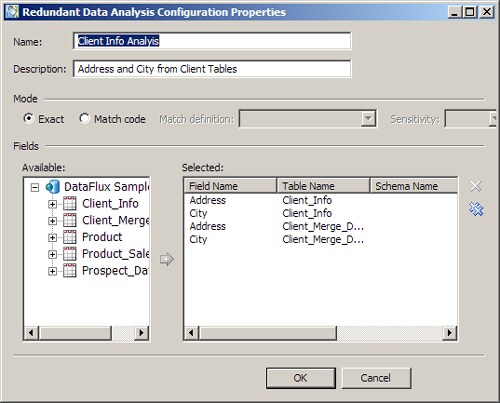
- Click OK to save the configuration and run the redundant data analysis. When you create a redundant data analysis configuration in the Report tab, the configuration is saved for the current report only. You cannot access the new configuration in a Redundant Analysis Configuration dialog that you open from the Properties tab.
![]() Note: You can also prepare a redundant data analysis in the Properties tab, so that the analysis is run along with the rest of the profile report. Click Analyze Redundant Data in the Actions menu. Then, click Add in the Redundant Data Analysis Configurations dialog to access the Redundant Data Analysis Properties dialog. Then, perform the process described in this section. Configurations created on the Properties tab are available in the Properties tab itself and in any report that is generated from the properties.
Note: You can also prepare a redundant data analysis in the Properties tab, so that the analysis is run along with the rest of the profile report. Click Analyze Redundant Data in the Actions menu. Then, click Add in the Redundant Data Analysis Configurations dialog to access the Redundant Data Analysis Properties dialog. Then, perform the process described in this section. Configurations created on the Properties tab are available in the Properties tab itself and in any report that is generated from the properties.
Review Redundant Data Analysis Results
The redundant data analysis displays a table that matches the selected fields against each other in a grid and a Venn diagram that shows the data for each match. The Grid data field determines whether this grid displays left outliers, common data, or right outliers. Then, you manipulate the Venn diagram by clicking cells in the grid.
![]() Note: You can put your cursor over a cell in the grid to display the DSN name and the table name in a tooltip.
Note: You can put your cursor over a cell in the grid to display the DSN name and the table name in a tooltip.
For example, the following selection:
- Common grid data
- Address in Client_Info matched to Address in Client_Merge_Data
displays the following diagram:
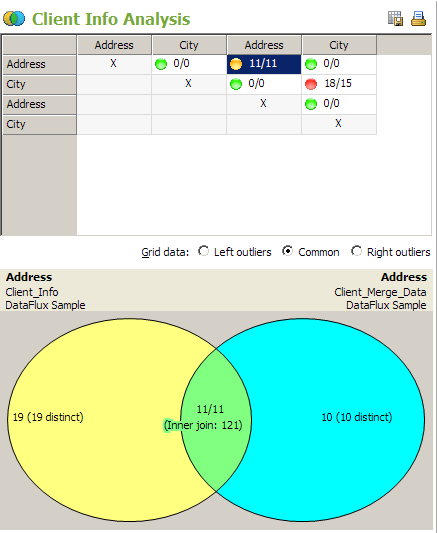
Note the use of color. The cells in the grid are marked by green, yellow, and red circles, which indicate the likelihood of redundant data. Green cells have a redundancy of fewer than 20%. Red cells have the most common data and greater than 50% chance of redundancy. Yellow cells fall in the middle, with a redundancy level of between 20% and 50%. Similarly, each table in the Venn Diagram has a distinct color. The union between the two tables has a color that blends the table colors.
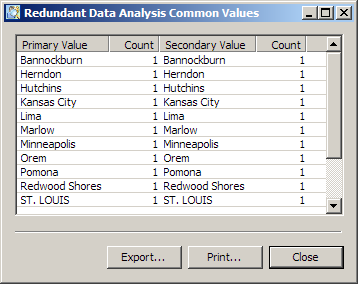
You can see that this match generates 19 distinct left outliers, 10 distinct right outliers, and 11 common values. You can click in any region of the diagram to see a list of values that you can export and print. The following display shows the values for the inner join area of the diagram: