DataFlux Data Management Studio 2.7: User Guide
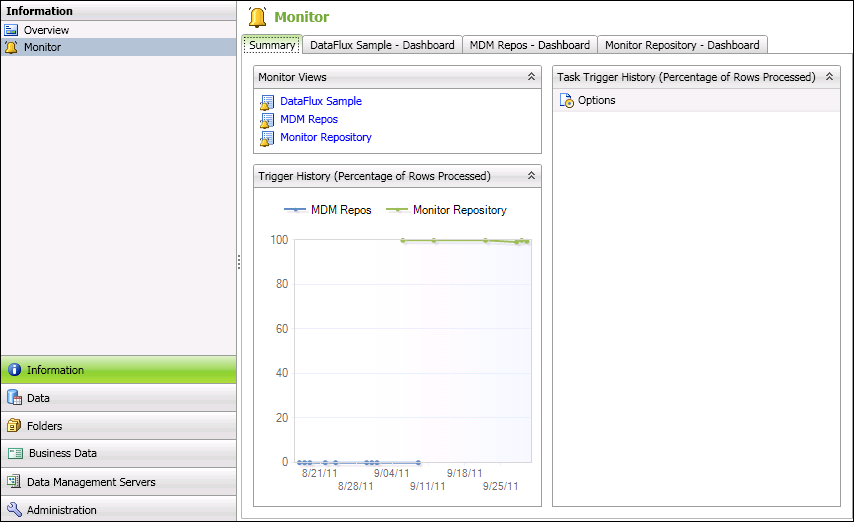
As explained in Monitoring Data, the Monitor pane displays exceptions to monitored business rules. The exceptions are generated by data monitoring jobs that are created in Data Management Studio.
A business rule is associated with a task that specifies an action to be taken when an exception to the rule is encountered. This task is selected in a Data Monitoring node in a data job. When the job is run, the selected task is executed. Any exceptions to the rule trigger the specified action, and the triggers are logged to the current repository. These trigger statistics and related statistics appear in the various interfaces that are available from the Monitor pane.
The Monitor pane contains the following elements:
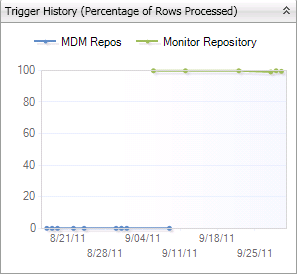
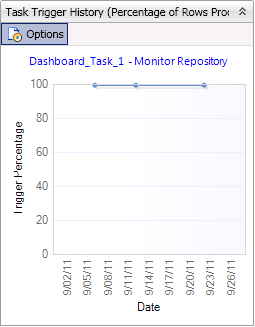
The Summary tab displays data-monitoring statistics for all repositories to which you are connected, if any statistics are available. Data monitoring statistics will be available for a repository only if data monitoring jobs have been created and executed in that repository. Statistics include Total Trigger History, Task Trigger History, and the Triggers per Date graphs, which show a percentage of triggers per records processed. The graph scale is from 0 to 100, representing percent. For example, if you have 11 triggers in 3276 rows, the triggers would represent 0.34% of the records processed. If you mouse over the data point, you will get a tooltip with some helpful information such as "... 11 triggers in 3276 rows."
The Summary tab displays the following information:
Each repository to which you are connected has a dashboard tab with a name such as DataFlux Sample - Dashboard, etc. Each repository dashboard contains the following elements:
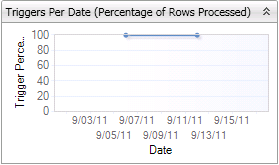
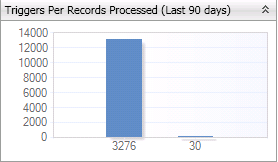
![]() Note: The Total Trigger History, Task Trigger History, and the Triggers per Date show a percentage of triggers per records processed. The graph scale is from 0 to 100, representing percent. For example, if you have 11 triggers in 3276 rows, the triggers would represent 0.34% of the records processed. If you mouse over the data point, you will get a tooltip with some helpful information such as "... 11 triggers in 3276 rows."
Note: The Total Trigger History, Task Trigger History, and the Triggers per Date show a percentage of triggers per records processed. The graph scale is from 0 to 100, representing percent. For example, if you have 11 triggers in 3276 rows, the triggers would represent 0.34% of the records processed. If you mouse over the data point, you will get a tooltip with some helpful information such as "... 11 triggers in 3276 rows."
|
Documentation Feedback: yourturn@sas.com
|
Doc ID: dfU_RiserInfoMon.html |