Using the Summary Tab and Dashboard Tabs
The Summary tab and the dashboard tabs can be accessed from the Monitor pane of the Information riser bar. These tabs provide a high-level, interactive view of the exceptions to monitored business rules. They provide a summarized view of the same exceptions that are displayed in Monitor Viewer. You can use these tabs to quickly scan the status of the monitoring jobs in your repositories. Then, you can use the Monitor Viewer to drill-down to the business rule level in a selected repository and perform more detailed analysis.
The Dashboard contains a Summary tab and separate dashboard tabs for each of the repositories connected in DataFlux Data Management Studio. Perform the following tasks to use the Dashboard:
Access the Summary and Dashboard Tabs
You can access the Summary tab and dashboard tabs by clicking Monitor on the Information riser bar. This displays the Monitor pane, where you click the Summary tab or one of the repository dashboard tabs.
Review the Summary Tab
The following display shows a sample Summary tab:
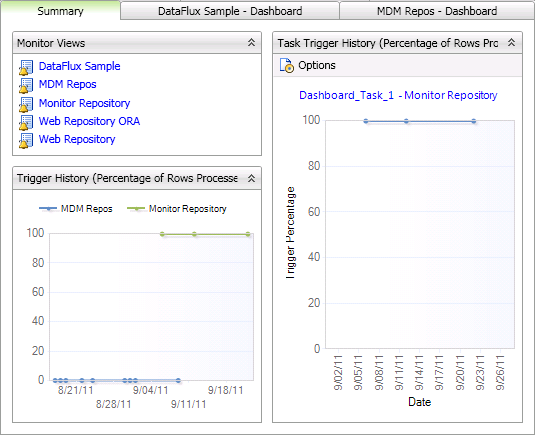
Review the following sections:
- Monitor Views - Enables you to select the Monitor Viewer of any connected repository. For more information about this dialog, see Using the Monitor Viewer.
- Task Trigger History - Displays the trigger history expressed as a percentage of rows processed for the repositories that contain monitoring jobs
- Trigger History - Displays the task trigger history expressed as a percentage of rows processed for the task that you select in the Task Options dialog. Click Options to access a dialog where you can select a repository, and then select one or more tasks in that repository to include in the Task Trigger History graph. It is best to select a limited number of tasks, so that the graph will be understandable.
Examine a Repository Dashboard Tab
The following display shows a sample repository Dashboard tab:
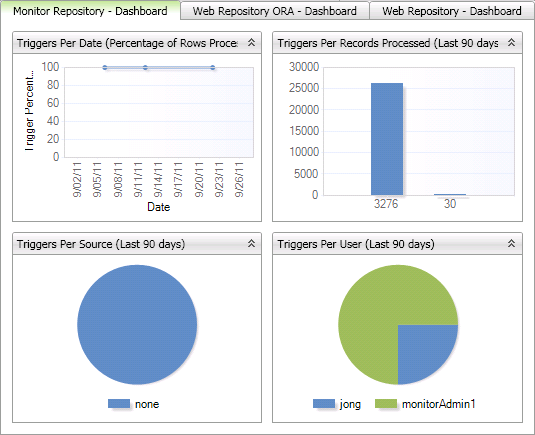
Examine the following sections, each of which contains a graph against the monitoring jobs for the selected repository:
- Triggers Per Date - Displays the task trigger history expressed as a percentage of rows processed for the monitoring jobs. Double-click the trend line to display the Monitor Viewer with the relevant filters and the graph in the History Graph tab.
- Triggers Per Records - Displays the triggers per date for the past 90 days for the monitoring jobs. Double-click the bar to display the Monitor Viewer with the relevant filters and the graph in the History Graph tab.
- Triggers Per Source - Displays the triggers per source for the past 90 days for the monitoring jobs. Double-click the circle to display the Monitor Viewer with the relevant filters and the graph in the History Graph tab.
- Triggers Per User - Displays the triggers per user for the past 90 days for the monitoring jobs. Double-click the circle to display the Monitor Viewer with the relevant filters and the graph in the History Graph tab.