SAS® AppDev Studio™ 3.0 Developer's Site
| Bar Line Chart |
|
|
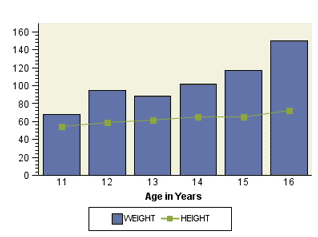
This example shows how to create a basic Bar Line Chart for display in a JSP page.
See It
| Bar Line Chart |
|
|
This example shows how to create a basic Bar Line Chart for display in a JSP page.