Managing Output
Sorting Your Output
You can sort the output from your query by one or more columns from the tables that are used in the query.
Note: It is possible to sort the
output table by columns that are not selected for the output.
To sort your output:
-
You can add one or more columns to the Sort tab by dragging them from the columns list to the Sort tab. You can also click
 on the Sort tab toolbar and select one or more columns from the Choose Column window.
-
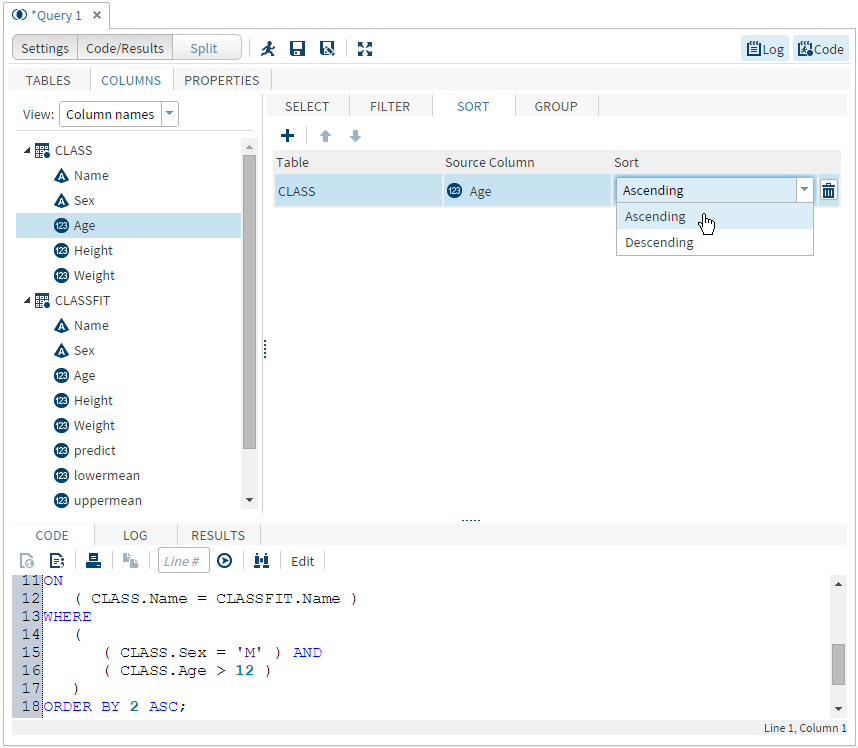
Click the Sort box for the column on which you want to sort the data. From the drop-down list, select Ascending or Descending. The default sort direction is Ascending.
-
If you are sorting by multiple columns, the output table is sorted first by the column that is listed first. Within each level of the first column, the rows are sorted by the second column in the list, and so on. You can change the sort order by selecting a column and clicking
 and
and  to move the column up and down the list.
Eliminating Duplicate Rows in Output
Some types of queries output multiple, identical rows. Because these duplicate rows are generally not useful, SAS Studio enables you to keep only one of the identical
rows and eliminate the duplicates.
To eliminate duplicate rows, click the Select tab and select the Select
distinct rows only check box.
Grouping Your Output
If you have created a summarized column, you can choose to classify your data into
groups based on the values in a column. This is equivalent to using the GROUP BY clause
in an SQL query. For example, if you are calculating the average height of a group
of students, you
might want to group the results by age so that you can see the average height for
each age group.
By default, the Automatically
select groups option is selected on the Group tab. When this option is selected and you have performed a summary function on a
column, your query is automatically grouped by all columns without summary functions.
You can choose
to edit the list of columns that the query is grouped by.
To group your output:
-
You can add one or more columns to the Group tab by dragging them from the columns list to the Group tab. You can also click on the Group tab toolbar and select one or more columns from the Choose Column window.
Note: To remove all of the automatically selected columns from the Group tab, clear the Automatically select groups option.
The following example
shows you how to find the average weight of students in each age group.
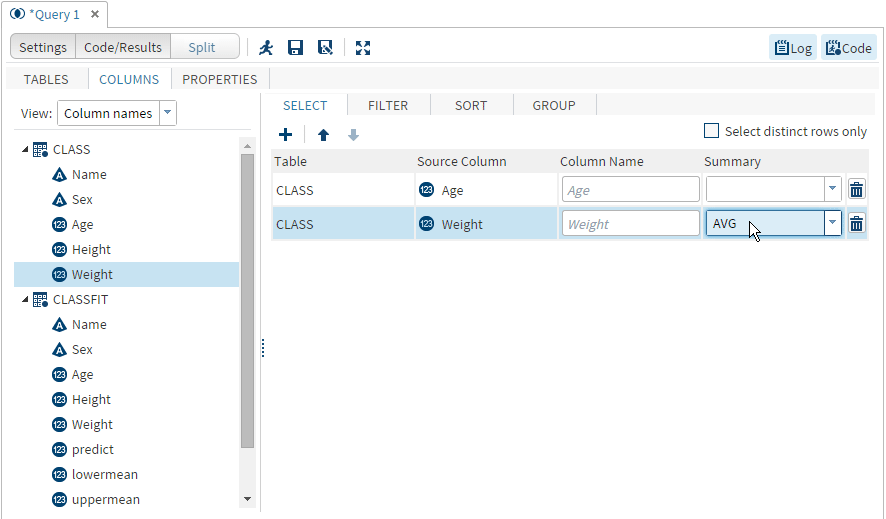
First, add the Age and Weight columns to the Select tab, and then
select the AVG summary function for the Weight column:
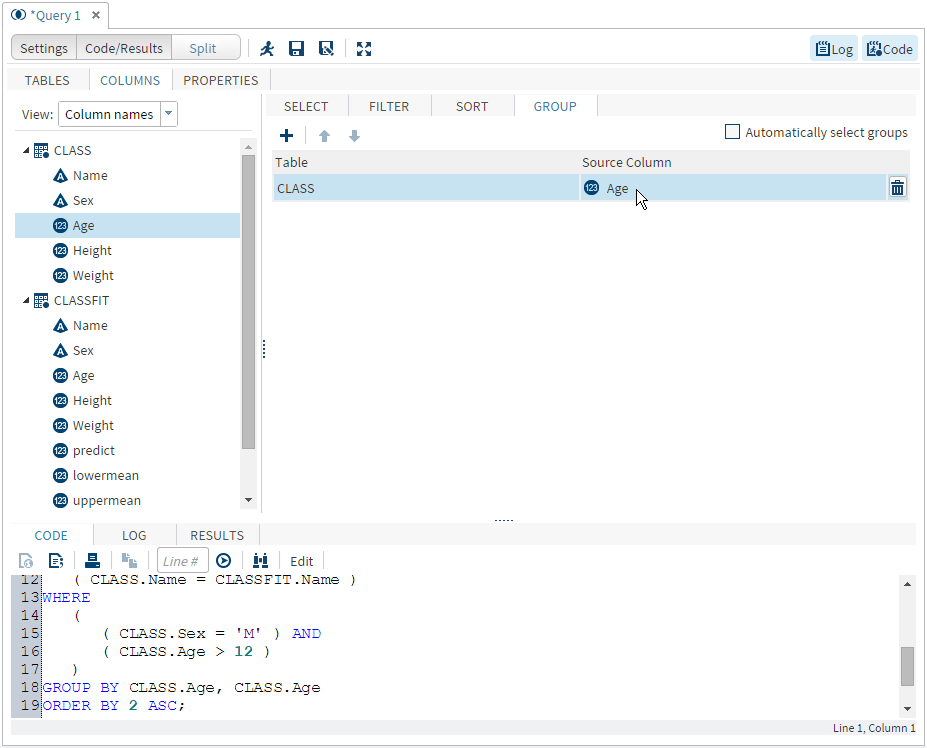
To see the average weight of students by age, the query is grouped by the Age column.
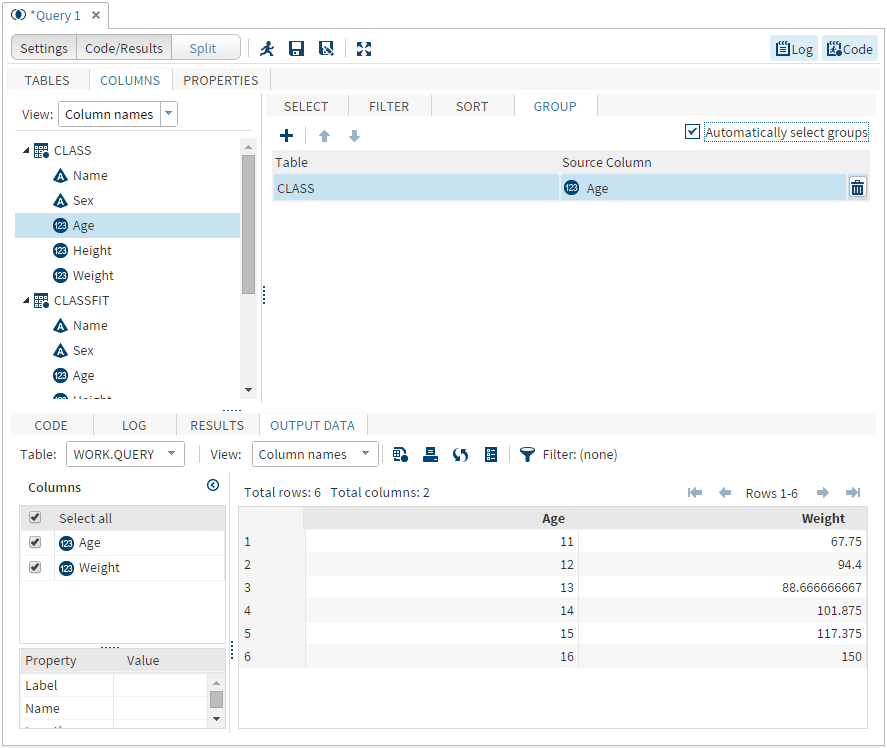
The results show the average weight for each age group:
Note: By default, the query generates
a table of the result. To generate a report of the results (which
is displayed in Results tab), you must specify
report as the output type for the query. For more information,
see Saving Your Results.
Saving Your Results
You can choose to generate your results in any one of three formats: data table, data view, or report.
If you save your results as a data table or data view, you can specify the library and filename that you want to use. If you don’t specify the library and filename,
the results are saved in the Work library.
To specify the results format:
-
Click the Properties tab. In the Results area, select the format that you want to use from the Output type drop-down list.Reportsaves the query results as a report that you can download as an HTML, PDF, or RTF file. Query results in this format are not updated until you rerun the query. You cannot run SAS tasks against query results in this format.Tablesaves the query results as a static data table against which you can run SAS tasks. Query results in this format are not updated until you rerun the query. By default, the data table is stored in the Work library.Viewsaves the query results as a dynamic data view against which you can run SAS tasks. Each time you open query results in the data view format, the results are updated with any changes to the data that is used in the query. By default, the data view is stored in the Work library.
To save your results
to a specific location:
Running a Query
After you specify all the criteria for your query, you can generate your results by
clicking  on the query window toolbar. The output data opens in the workspace on a separate tab.
on the query window toolbar. The output data opens in the workspace on a separate tab.
Copyright © SAS Institute Inc. All rights reserved.