Count Data Regression Task
About the Count Data Regression Task
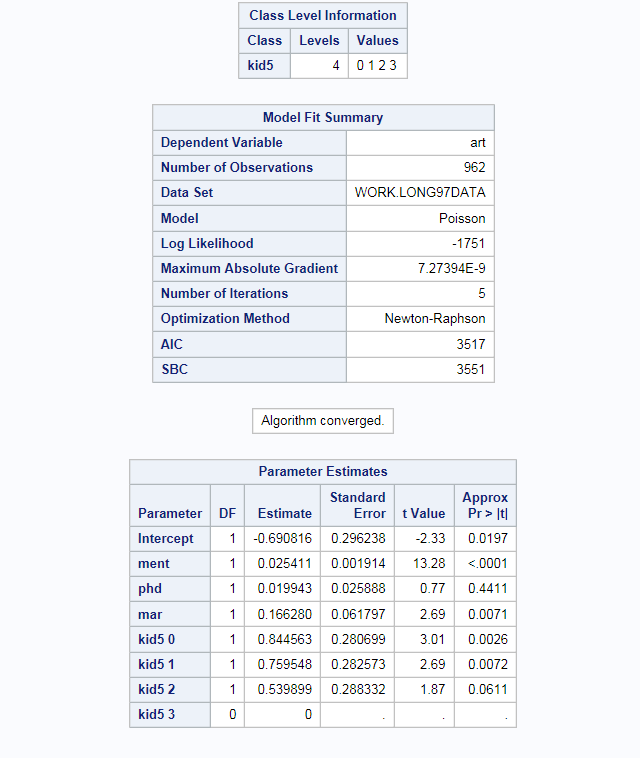
The Count Data Regression task performs a regression analysis of a continuous dependent variable. This variable takes a nonnegative integer value from distributions such as Poisson, negative binomial, zero-inflated Poisson, and zero-inflated negative binomial.
Note: Your site must license SAS/ETS
to use this task. The version of the task depends on what version
of SAS/ETS is available at your site. For example, if your site is
running SAS 9.4 or earlier, SAS Studio is running version 1 of the
Count Data Regression task. If your site is running the first maintenance
release for SAS 9.4 or later and SAS/ETS 13.1 or later is available,
then SAS Studio is running version 2 of the Count Data Regression task.
The difference between the two versions is the addition of new options
in SAS/ETS 13.1 or later.

Assigning Data to Roles
To run the Count Data
Regression task, you must assign a column to the Dependent
variable role.
|
Role
|
Description
|
|---|---|
|
Dependent
variable
|
specifies the numeric column that has nonnegative integer or count values.
The Distribution option
specifies the type of model to be analyzed. You can specify these
types of models:
If you select a zero-inflated distribution, you can specify the link function to use to compute the probability of zeros.
|
|
Continuous
variables
|
specifies the independent covariates (regressors) for the regression model. If you do not specify a continuous variable, the task fits a model that contains only an intercept.
|
|
Categorical
variables
|
specifies the variables
to use to group data in the analysis.
|
Setting Options
|
Option
|
Description
|
|---|---|
|
Methods
|
|
|
Type of
covariances of the parameter estimates
|
specifies the type of covariance matrix of the parameter estimates.
You can specify these
types of matrices:
|
|
Include
the intercept in the model
|
specifies whether to include the intercept in the model.
|
|
Optimization
|
|
|
Method
|
specifies the iterative
minimization method to use.
|
|
Maximum
number of iterations
|
specifies the maximum number of iterations for the selected method.
|
|
Statistics
|
|
|
You can specify whether
to include in the results the default statistics that the task creates,
the default statistics and any additional statistics that you select,
or no statistics.
Here are the additional
statistics that you can include in the results:
|
|
|
Plots
Note: The plot options are available
only if you are running the first maintenance release for SAS 9.4
or later.
|
|
|
Select plots
to display
|
specifies whether to include in the results only the default plots, only the plots that you choose, or no plots.
|
|
Diagnostic Plots
|
|
|
Profile
likelihood plot
|
produces the profile likelihood functions of the model parameters. The model parameter on the X axis is varied, whereas all other parameters are fixed
at their estimated
maximum likelihood estimates.
|
|
Overdispersion
diagnostic plot
|
produces the overdispersion diagnostic plot.
|
|
Probability Plots
|
|
|
Overall
predictive probabilities plot
|
produces the overall
predictive probabilities of the specified count levels.
|
|
Predictive
probability profiles plot
|
produces the predictive probability profiles of specified count levels against model
regressors. The regressor on the X axis is varied, whereas all other regressors are fixed at the mean of the
observed data set.
|
|
Specified
count levels
|
supplies the values of the response variable for the overall predictive probabilities plot and the predictive probability profiles plot. Each value should be a nonnegative integer. Nonintegers are rounded to the nearest
integer.
This value can also be a list in the form X TO Y BY Z. For example, COUNTS(0 1 2 TO
10 BY 2 15) creates a plot for counts 0, 1, 2, 4, 6, 8, 10, and 15.
|
|
Zero-Inflation Plots
Note: The Probability
profiles plot of zero-inflation process selection option
is available only if you select Zero-inflated Poisson or Zero-inflated
negative binomial as the distribution for the dependent
variable.
|
|
|
Probability
profiles plot of zero-inflation process selection
|
produces the probability profiles of zero-inflation process selection and zero count
prediction against model regressors. The regressor on the X axis is varied, whereas
all other regressors are fixed at the mean of the
observed data set.
|
|
Display
as
|
specifies whether to display the plots in a panel or individually. This option applies
to all distributions.
|
Copyright © SAS Institute Inc. All rights reserved.