N-Way ANOVA Task
About the N-Way ANOVA Task
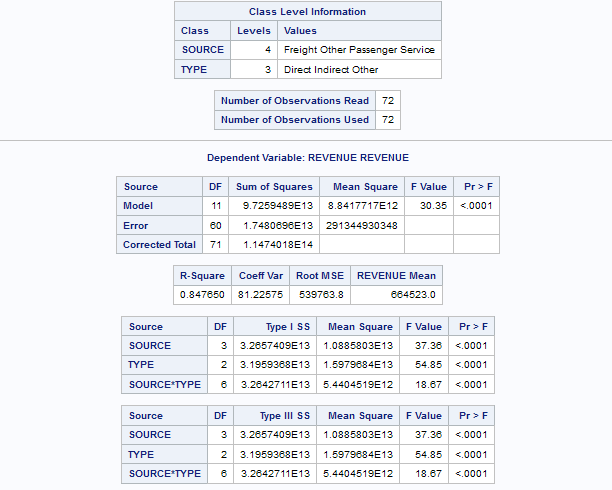
The N-Way ANOVA task tests and provides graphs for effects of one or more factors
on the means of a single, continuous dependent variable.
Note: You must have SAS/STAT to
use this task.

Assigning Data to Roles
To run the N-Way ANOVA
task, you must assign columns to the Dependent variable and Factors roles.
|
Role
|
Description
|
|---|---|
|
Dependent
variable
|
specifies the dependent variable.
|
|
Factors
|
specifies the classification variables.
|
Building a Model
Requirements for Building a Model
By default, no effects are specified, which results in the task fitting an intercept-only model. To run the task, you must assign at least two variables to the Factors role. You can select combinations of variables to create crossed, nested, factorial, or polynomial effects.
To create a model, use
the model builder on the Model tab. After you create your model, you can specify whether to include the intercept in the model.
Create a Nested Effect
Nested effects are specified by following a main effect or crossed effect with a classification variable or list of classification variables enclosed in parentheses. The main effect or crossed
effect is nested within the effects listed in parentheses. Here are examples of nested
effects: B(A),
C(B*A), D*E(C*B*A). In this example, B(A) is read "A nested within B."
Create a Full Factorial Model
For example, if you
select the Height, Weight, and Age variables and then click Full
Factorial, these model effects are created: Age, Height, Weight, Age*Height, Age*Weight, Height*Weight, and Age*Height*Weight.
Create an N-Way Factorial
For example, if you
select the Height, Weight, and Age variables and then specify the
value of N as 2, when you click N-way Factorial, these model effects are created: Age, Height, Weight, Age*Height, Age*Weight, and
Height*Weight. If N
is set to a value greater than the number of variables in the model, N is effectively
set to the number of variables.
Setting Options
|
Option
|
Description
|
|---|---|
|
Statistics
|
|
|
You can choose to display
only the default statistics, the default statistics and additional
statistics, or no statistics in the output.
Here are the options
for the additional statistics:
|
|
|
Plots
|
|
|
You can choose to display only the default plots, only selected plots, or no plots in your output. You can specify the maximum number
of points to display in the plots.
Here are some plots
that you can include in your results:
|
|
Setting the Output Options
You can specify whether to create an output data set. You can also specify the values to include in the output data set. You can include predicted values, residuals, standard errors, and influence statistics.
Copyright © SAS Institute Inc. All rights reserved.