Characterize Data Task
About the Characterize Data Task
The Characterize Data task creates a summary report of tables and graphs that describe the variables in the input data set. This task can also create frequency and univariate SAS data sets that describe the main characteristics of the data. The Characterize Data task is
useful when you are working with a new data set and enables you to better understand the scope and range of the variables in the
data.
Example: Characterize Data Task

Assigning Data to Roles
You must select a data source to run the Characterize Data task, and you must select at least one variable to characterize.
This task uses automatic characterization to determine the type for your variable.
However, you can override this characterization by using the Custom Characterization options. For example, in the Sashelp.Class data set, Age is automatically treated
as a numeric variable. You could override this characterization and specify that Age should be treated
as a categorical variable because in the analysis you want to treat each value of Age as a group.
|
Role
|
Description
|
|---|---|
|
Automatic Characterization
|
|
|
Variables
|
specifies the variables
that you want to analyze.
|
|
Custom Characterization
|
|
|
Categorical
variables
|
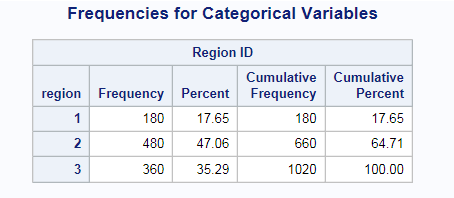
specifies the frequency tables to produce.
|
|
Date variables
|
specifies the date variables to analyze.
|
|
Roles
|
|
|
Grouping
variable
|
specifies that the table is sorted by the selected variable or variables, and a listing
is generated for each distinct value, or BY group, in the variable or combination of variables.
|
Setting Options
|
Option Name
|
Description
|
|---|---|
|
Categorical Variables
|
|
|
Frequency
table
|
displays a frequency table in the results.
|
|
Frequency
chart
|
displays a frequency chart in the results.
|
|
Treat missing
values as valid level
|
treats missing values as a valid nonmissing level for all variables in the table.
|
|
Limit categorical
values
|
specifies the maximum number of variable levels to display in one-way frequency tables.
|
|
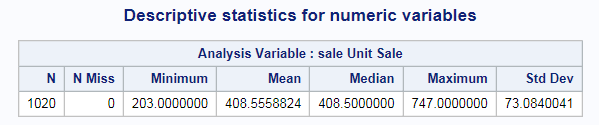
Numeric variables
|
|
|
Descriptive
statistics
|
displays the descriptive statistics for any numeric variables that you assigned to the Variables role.
|
|
Histogram
|
displays a histogram for any numeric variables that you assigned to the Variables role.
|
|
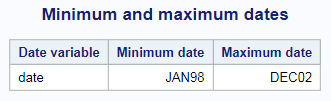
Date Variables
|
|
|
Display
minimum and maximum date
|
shows the minimum and
maximum date for each variable that you assigned to the Date
variables role.
|
|
Frequency
plot
|
displays a frequency plot in the results.
|
Copyright © SAS Institute Inc. All rights reserved.