Characterize Data Task

About the Characterize Data Task

The Characterize Data task creates a summary report, graphs, and frequency and univariate SAS data sets that describe the main characteristics of the data.

Example: Characterize Data Task

In this example, you want a better understanding of the contents in the Sashelp.Pricedata data set.
To create this example:
  1. In the Tasks section, expand the Data folder and double-click Characterize Data. The user interface for the Characterize Data task opens.
  2. On the Data tab, select the SASHELP.PRICEDATA data set.
  3. To run the task, click Submit SAS code.
Here is a sample of the results:
Summary of Categorical Variables for Sashelp.Pricedata
Summary of Numeric Variables for Sashelp.Pricedata
Categorical Variable Value Counts for Sashelp.Pricedata
Bar Chart of Unit Sales for Sashelp.PriceData
By default, the task also creates output data—a table with the frequency data and a table with the univariate data. Both of these tables are saved in the Work library.

Assigning Data to Roles

You must select a data source to run the Characterize Data task. However, no roles are available.

Setting Options

Option Name
Description
Output Options
You must select at least one output option. By default, a summary report, graphs, and output tables for the frequency data and univariate data are created.
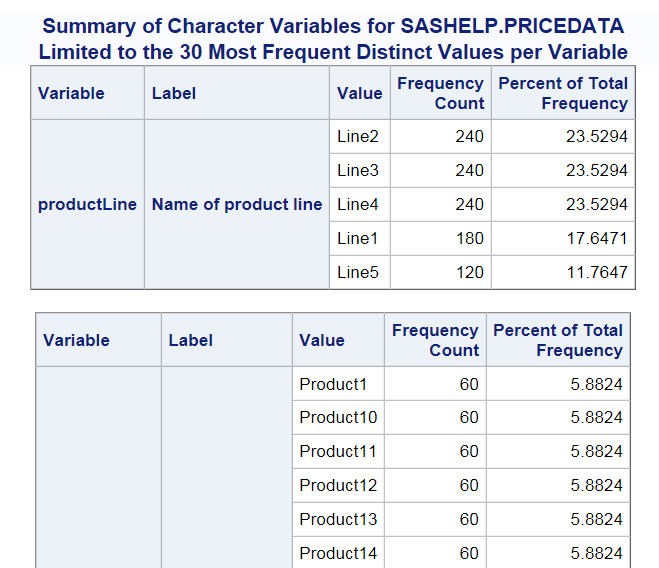
Limit categorical values
Specifies the maximum number of categorical values to report per variable. By default, 30 values are reported. You can change this maximum value in the Maximum number of unique values per variable box.