High-Performance CorrelationsTask

About the High-Performance Correlations Task

Correlation is a statistical procedure for describing the relationship between numeric variables. The relationship is described by calculating correlation coefficients for the variables. The High-Performance Correlations task calculates a Pearson product-moment correlation. This is a parametric measure of association for two continuous random variables. Correlations range from –1 to 1.
Note: This task is available only if you are running SAS 9.4.

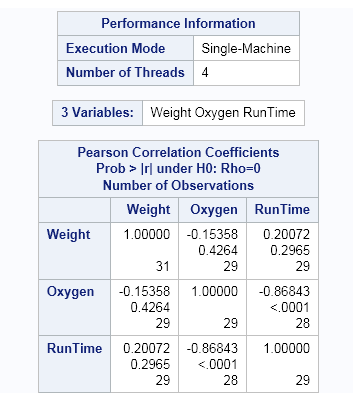
Example: Correlation between Weight, Oxygen, and Run Time

To create this example:
  1. Create the Work.Fitness data set. For more information, see FITNESS Data set.
  2. In the Tasks section, expand the High-Performance Statistics folder and double-click Correlations. The user interface for the High-Performance Correlations Analysis task opens.
  3. On the Data tab, select the WORK.FITNESS data set.
  4. To the Analysis variables role, assign the Weight, Oxygen, and RunTime columns.
  5. To run the task, click Submit SAS Code.
Here are the results:
Performance Information and Pearson Correlation Coefficients

Assigning Data to Roles

To run the High-Performance Correlations task, you must assign two columns to the Analysis variables role.
Role
Description
Roles
Analysis variables
specifies the columns to use to calculate the correlation coefficients.
Additional Roles
Frequency count
specifies a numeric column whose value represents the frequency of the observation.
Weight
specifies the weights to use in the calculation of Pearson weighted product-moment correlation.

Setting Options

Option Name
Description
Methods
Missing values
specifies whether to include missing values in the calculations.
  • If you select the Use nonmissing values for all selected variables options, any observations that have missing values are excluded from the analysis.
  • If you select the Use nonmissing values for pairs of variables option, the data for an observation contributes to the correlation between two variables as long as both values are nonmissing. As a result, the correlations that are calculated for the analysis variable might be based on a different number of observations.
Statistics
You can specify whether the results include only the statistics that the task automatically generates, the statistics that you selected, or no statistics. By default, only the correlations table is displayed in the results.
You can include these statistics in the results:
  • correlations
  • covariances
  • sum of squares and cross-products
  • corrected sum of squares and cross-products
  • descriptive statistics
Display p-values
specifies whether to display for each correlation coefficient the probability of observing a more extreme value than the observed coefficient.
Order correlations from highest to lowest
displays the ordered correlation coefficients for each variable. Correlations are ordered from highest to lowest in absolute value.

Creating an Output Data Set

You can specify whether to save the results to an output data set, which is saved in the Work library by default.
By default, the output data set contains the correlations. You can also include covariances, sum of squares and cross-products, and corrected sum of squares and cross-products.