The Histograms task
creates a chart that displays the frequency distribution of a numeric
variable.
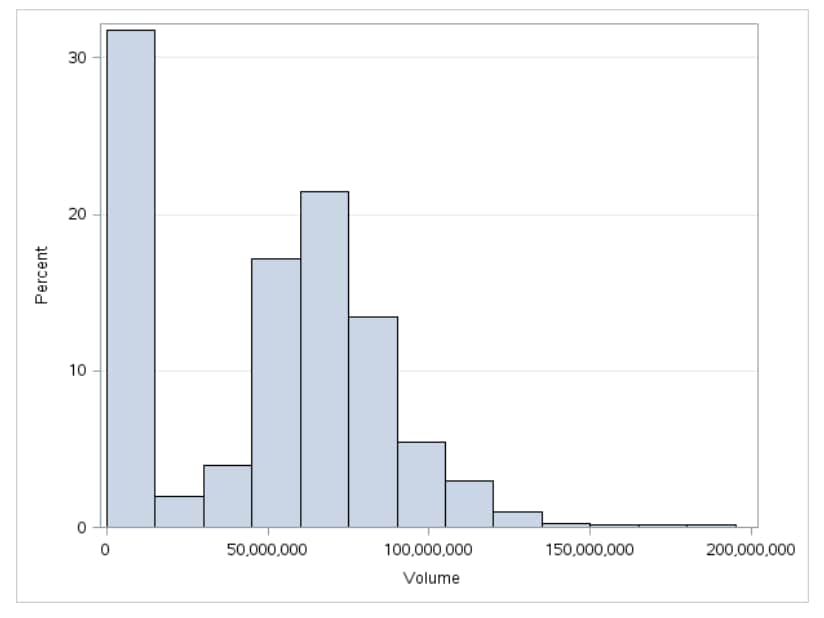
Example: Histogram of Stock Volume
To create this example:
In the Tasks section,
expand the Graph folder and double-click Histogram.
The user interface for the Histogram task opens.
In the Data tab,
select the SASHELP.STOCKS data set.
To the Analysis
variable role, assign the Volume column.
To run the task, click .
Here are the results:
Assigning Data to Roles
To run the Histogram
task, you must assign a column to the Analysis variable role.
Setting Options
Option Name
Description
Title and Footnote
You can specify a custom
title and footnote for the output.
Density Curves
You can specify whether
to create a density curve that shows the distribution of values for
a numeric variable. You can create density curves for normal and kernel
distributions.
Bin Details
For the bins in the
histogram, you can specify the color and the transparency.
Horizontal Axis
Interval
axis
creates tick marks at
regular intervals on the horizontal axis based on the minimum and
maximum values of the analysis variable.
Bin axis
creates tick marks at
the midpoints of the value bins on the horizontal axis.
Specify
number of bins
enables you to specify
the number of bins in the histogram. Valid values range from 2 to
20.
The bins always span
the range of data. The task tries to produce tick values that are
easily interpreted (for example, 5, 10, 15, 20). Sometimes the location
of the first bin and the bin width might be adjusted. By default,
the task automatically determines the number of bins.
Show label
displays the label for
the analysis variable along the horizontal axis. You can also enter
a custom label.
Vertical Axis
Specify
axis scaling
specifies the scaling
that is applied to the vertical axis. You can choose from these options:
COUNT
the axis displays the
frequency count
PERCENT
the axis displays values
as a percentage of the total.
PROPORTION
the axis displays values
as proportions (0.0 to 1.0) of the total.
Show grid
specifies whether to
show the grid lines for the vertical axis.
Show label
specifies whether to
show the label for the type of axis scaling.
Legend Details
Show legend
specifies whether to
display a legend in the output.
Legend location
specifies whether the
legend is placed outside or inside of the axis area.
Graph Size
You can specify the
width and height of the graph in inches.