|
|
|
|
|
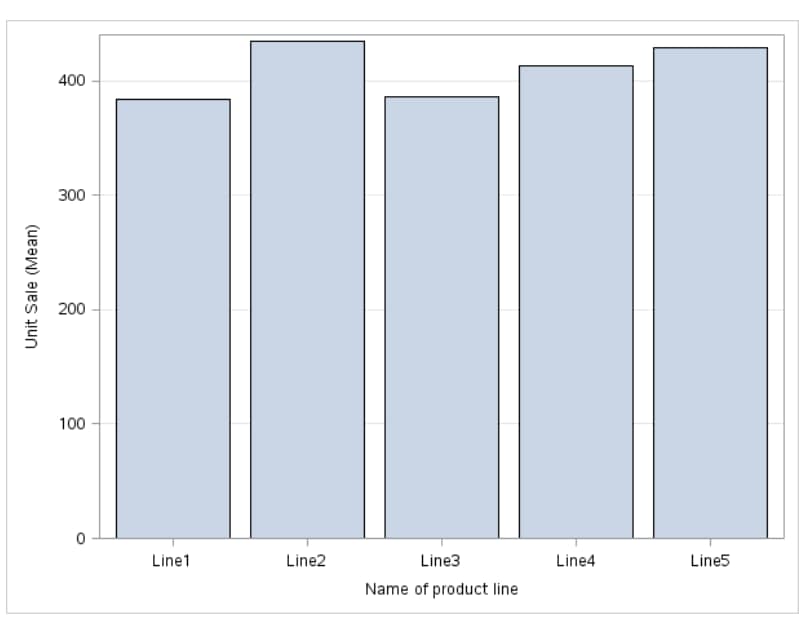
You can create either
a vertical or horizontal bar chart.
|
|
|
You can specify a custom
title and footnote for the output.
|
|
|
|
|
displays group values
as separate adjacent bars that replace the single category bar. Each
set of group values is centered at the midpoint tick mark for the
category.
|
|
|
overlays group values
without any clustering. Each group is represented by unique visual
attributes derived from the GraphData1... GraphData n style
elements in the current style.
|
|
|
|
|
calculates the mean
of the response variable.
|
|
|
calculates the sum of
the response variable.
|
|
|
|
|
specifies which limit
lines to display. Limits are displayed as heavier line segments with
a serif at the end that extends from each bar. Limit lines are displayed
only if you select the Mean statistic.
|
|
|
specifies the statistic
for the limit lines.
|
|
|
specifies the number
of standard units for the limit lines. By default, this value is 1.
|
|
|
|
|
specifies the color
for the bars when a column is not assigned to the Group
variable role.
|
|
|
specifies the degree
of transparency for the plot. The range is 0 (completely opaque) to
1 (completely transparent).
|
|
|
specifies a special
effect to be used on all filled bars.
|
|
|
Show bar
labels or statistics
|
displays the values
of the calculated response as data labels.
|
|
|
|
|
specifies that the values for the
tick marks are displayed in reverse (descending) order.
|
Show values
in data order
|
places the discrete
values for the tick marks in the order in which they appear in the
data.
|
|
|
enables you to display
a label for the axis. Enter this label in the Custom label box.
|
|
|
|
|
creates grid lines at
each tick on the axis.
|
Append statistics
to axis label
|
includes the name of
the calculated statistic in the axis label. For example, if you are
calculating the mean, the axis label could be Weight (Mean).
|
|
|
enables you to customize
the label for the response axis. By default, the axis label is the
name of the variable.
|
|
|
|
|
specifies whether to
display a legend in the output.
|
|
|
specifies whether the
legend is placed outside or inside of the axis area.
|
|
|
You can specify the
width and height of the graph in inches.
|