Example: Correspondence Analysis
To create this example:
-
Copy and paste this code into the Program tab.
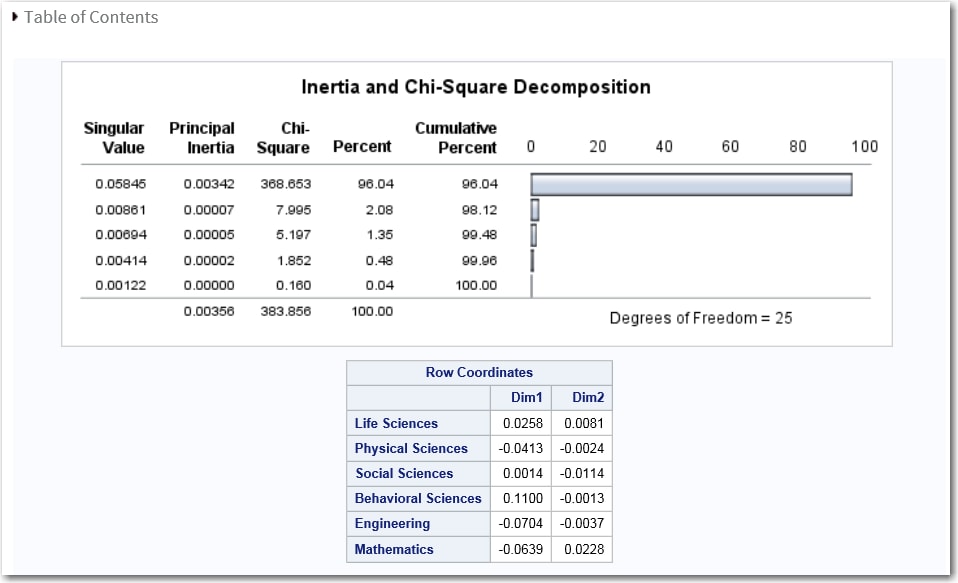
data PhD;
   input Science $ 1-21 y1973-y1978;
   label y1973 = '1973' y1974 = '1974' y1975 = '1975' y1976 = '1976'
      y1977 = '1977' y1978 = '1978';
datalines;
Life Sciences        4489 4303 4402 4350 4266 4361
Physical Sciences    4101 3800 3749 3572	 3410 3234
Social Sciences      3354 3286 3344 3278 3137 3008
Behavioral Sciences  2444 2587 2749 2878	 2960 3049
Engineering          3338 3144 2959 2791 2641 2432
Mathematics          1222 1196 1149 1003 959 959
;
Click to create the Work.PhD data set.
-
TipIf the data set is not available from the drop-down list, click
 . In the Choose a Table window,
expand the library that contains the data set that you want to use.
Select the data set for the example and click OK.
The selected data set should now appear in the drop-down list.
. In the Choose a Table window,
expand the library that contains the data set that you want to use.
Select the data set for the example and click OK.
The selected data set should now appear in the drop-down list.
Copyright © SAS Institute Inc. All rights reserved.