The Designer
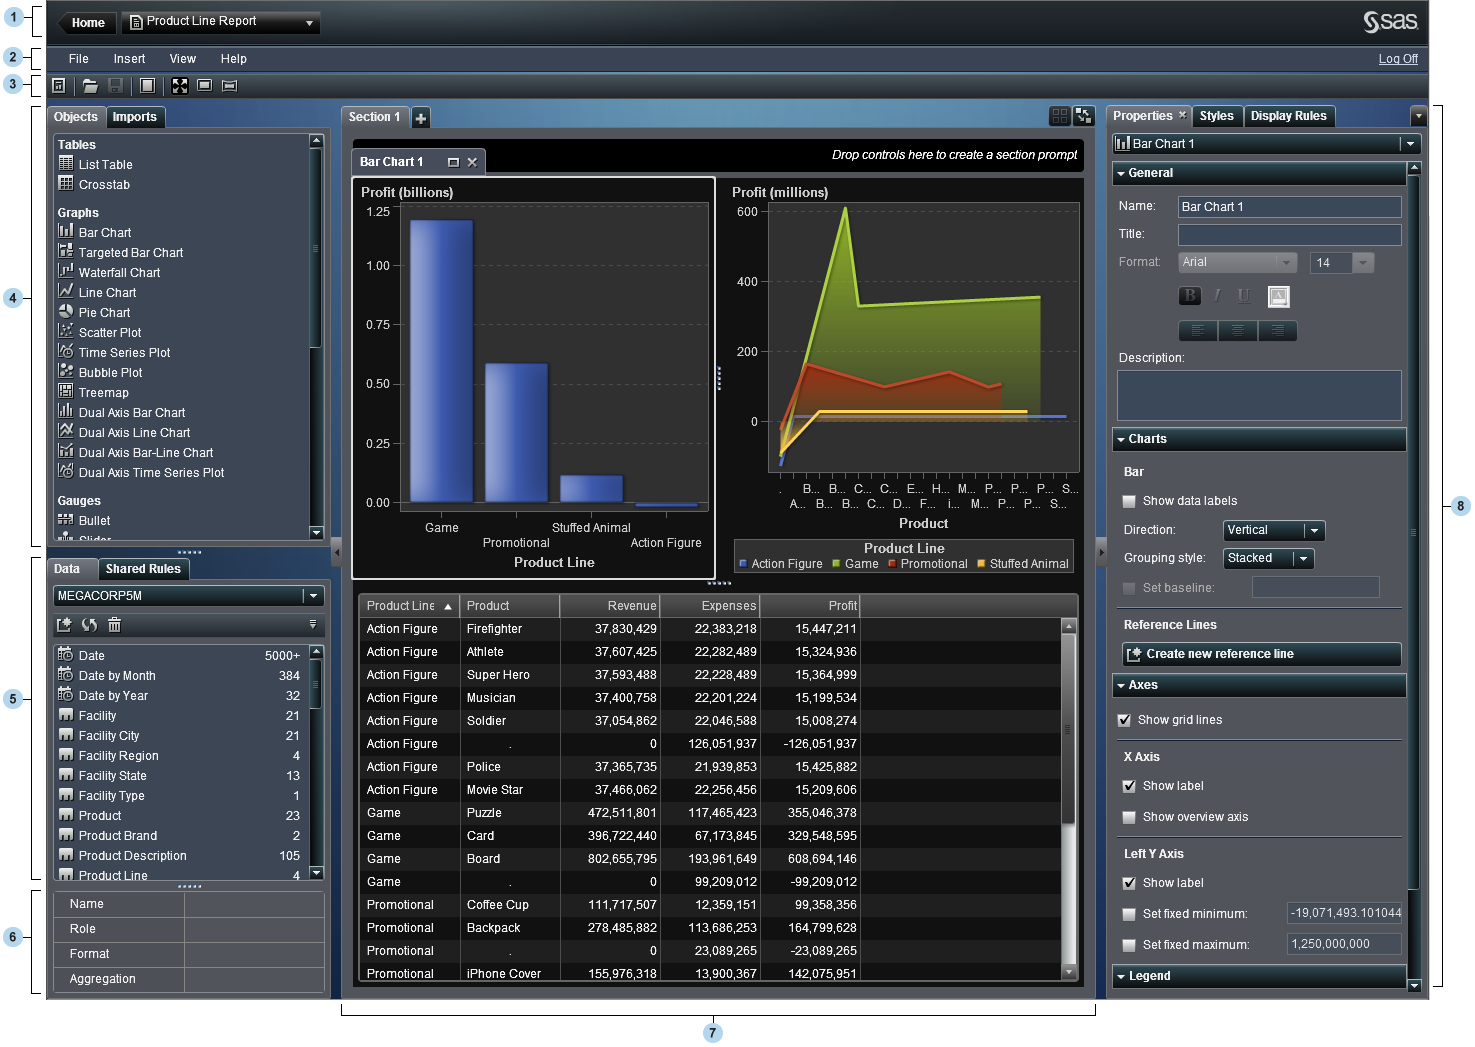
| 1 | The application bar provides access to the home page and recent objects. |
| 2 | The menu bar offers common tasks for the current report or section. |
| 3 | The toolbar enables you to expand the workspace and change a report’s canvas size. |
| 4 | The Objects tab enables you to add new report objects. The Imports tab enables you to import and reuse content from other reports. |
| 5 | The Data tab
enables you to select data. You can add, refresh, or remove a data
source using the icons above the list of data items. Using the local
menu ( ), you can change the data source, define a hierarchy,
define a calculated item, or show or hide data items. You can also
access the details for the measures in the data set. ), you can change the data source, define a hierarchy,
define a calculated item, or show or hide data items. You can also
access the details for the measures in the data set.
The Shared
Rules tab enables you to create and manage display rules
that are used by multiple gauges (for example, a display rule can
designate range intervals and colors).
|
| 6 | The data item table provides information about a selected data item, including the name, role, format, and aggregation. If you modify any of these data item properties, all report objects that use that data item are affected. |
| 7 | The canvas is the workspace for building a report. There is an area at the top of the canvas where you can drop filter controls and then categories to create section prompts. |
| 8 | The
right pane’s tabs enable you to work with details about a report
and its report objects. To access additional tabs or to display icons
instead of tab names, click  after the last tab name. after the last tab name.
|
Copyright © SAS Institute Inc. All rights reserved.