Exporting Content from the Designer
Overview of Exporting from the Designer
You can export an image
or data from a report object using the designer.
All users who have the Export Data capability can use the designer to export data from report objects to Microsoft Excel format for future viewing or printing. This exported output can be saved locally on disk,
and then opened in Microsoft Excel. Or you can choose to create a delimited text file Tab-Separated Values (*.tsv) or Comma-Separated Values (*.csv) data file.
Here are some key points
about exporting from the designer:
-
When you export a graph from the designer, you are exporting the data, not the visual graph representation.
-
Not all report objects in the designer support the exporting feature. For example, you cannot export data from gauges. If the export feature is not available for a particular report object, the Export <reportObjectName> menu item does not appear when you right-click on the object.
-
The designer does not preserve leading blanks in displayed data or exported data. However, you can filter for values that contain leading blanks.
-
The designer uses the locale of the SAS LASR Analytic Server to export data.
Export an Image
You can export an image for any list table, crosstab, graph, or gauge in a report. This is useful if you want to include the image of a report object in
a presentation, such as in Microsoft PowerPoint. Images are saved as PNG files.
Here are key points
about exporting an image:
-
An exported image does not show ranks or filters that are associated with the report object.
-
The image defaults to the size of the report object in the report.
-
The following characters in an image name are converted to an underscore when the image is exported:
/
                                    \ : * ? " < > | %
To export an image:
-
If the list table, crosstab, graph, or gauge that you want to export is not already selected, select it.
-
Right-click the report object, and select Export Image. The Save Image window is displayed.
-
Click Save. A download window is displayed.
-
Enter a name for the PNG file. Click Save.
Export Data from a List Table
To export data from
a list table:
-
If the list table that you want to export is not already selected, select it.
-
Right-click the list table, and select Export <listTableName>, where
<listTableName>is the name of the report object. The Export or Save As window is displayed.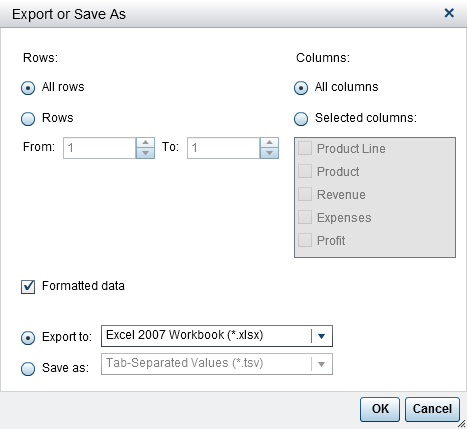
-
Choose to export All rows or a range of Rows.
-
Choose to export All columns or Selected columns. If you choose Selected columns, select the check box (or check boxes) to the left of the column (or columns) that you want to export. At least one column is required. If you do not select a column, then a message is displayed, and the Export or Save As window cannot be closed.
-
(Optional) To choose whether the exported data is formatted, either select or clear the Formatted data check box. This check box is selected by default.
-
If you select Export to, then the only option is Excel 2007 Workbook (*.xlsx) to create a Microsoft Excel spreadsheet.
-
If you select Save as, choose either Tab-Separated Values (*.tsv) or Comma-Separated Values (*.csv) to create a data file.
-
Click OK.
-
When you are prompted, choose either to open the file or to save it.
Export Data from a Crosstab
To export data from
a crosstab:
-
If the crosstab that you want to export is not already selected, select it.
-
Right-click on the crosstab, and select Export <crosstabName>, where
<crosstabName>is the name of the report object. The Export or Save As window is displayed.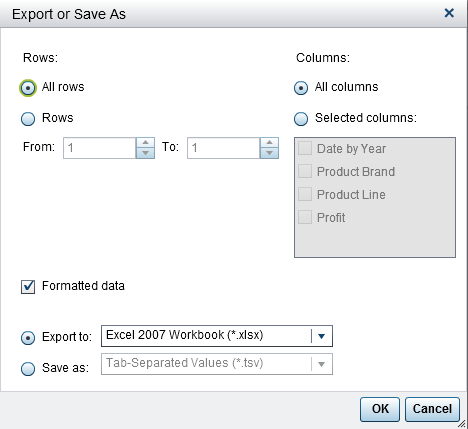
-
Choose to export All rows or a range of Rows.
-
Choose to export All columns or Selected columns. If you choose Selected columns, select the check box (or check boxes) to the left of the column (or columns) that you want to export. At least one column is required. If you do not select a column, then a message is displayed, and the Export or Save As window cannot be closed.
-
(Optional) To choose whether the exported data is formatted, either select or clear the Formatted data check box. This check box is selected by default.
-
If you select Export to, then the only option is Excel 2007 Workbook (*.xlsx) to create a Microsoft Excel spreadsheet.
-
If you select Save as, choose either Tab-Separated Values (*.tsv) or Comma-Separated Values (*.csv) to create a data file.
-
Click OK.
-
When you are prompted, choose either to open the file or to save it.
Note: The designer exports data
from a crosstab into a list table. This is different from SAS Visual
Analytics Explorer (the explorer), which exports data from a crosstab
into a crosstab.
Export Data from a Graph
Note: You cannot export the actual
visual graph. Only the data can be exported.
To export data from
a graph:
-
If the graph that you want to export is not already selected, select it.
-
Right-click on the graph, and select Export <graphName>, where
<graphName>is the name of the report object. The Export or Save As window is displayed.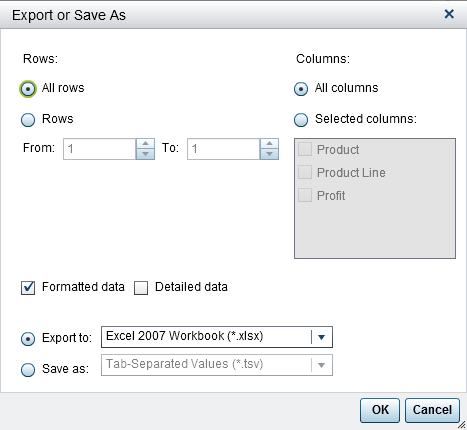
-
Choose to export All rows or a range of Rows.
-
Choose to export All columns or Selected columns. If you choose Selected columns, select the check box (or check boxes) to the left of the column (or columns) that you want to export. At least one column is required. If you do not select a column, then a message is displayed, and the Export or Save As window cannot be closed.
-
(Optional) Choose whether the exported data is formatted, either select or clear the Formatted data check box. This check box is selected by default.
-
(Optional) Choose whether detail data is exported for the graph. If you select Detailed data, then you can select the columns that you want to export.Note: The Detailed data option is not available for imported report objects, custom graph objects that have multiple data definitions, or for any graphs in which detail data is not allowed.
-
If you select Export to, then the only option is Excel 2007 Workbook (*.xlsx) to create a Microsoft Excel spreadsheet.
-
If you select Save as, choose either Tab-Separated Values (*.tsv) or Comma-Separated Values (*.csv) to create a data file.
-
Click OK.
-
When you are prompted, choose either to open the file or to save it.
Copyright © SAS Institute Inc. All Rights Reserved.
Last updated: January 8, 2019