Your First Look at SAS Visual Data Builder
Here are the features
of the data builder:
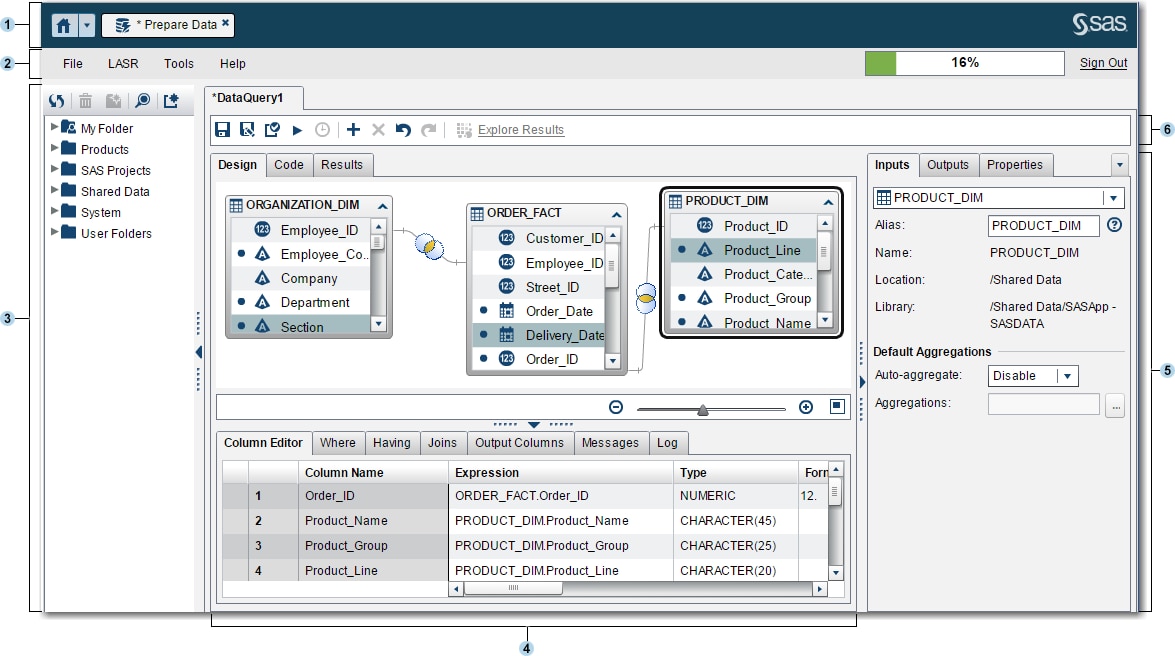
| 1 | The application bar enables you to return to the home page and to access other parts of SAS Visual Analytics and other SAS applications that integrate with the home page. You can access your recently created or viewed reports, explorations, stored processes, data queries, or other objects in your recent history. Buttons are displayed for each open application. |
| 2 | The menu bar contains menus that enable you to perform tasks such as creating new data queries and LASR star schemas. The right side of the menu bar has a memory gauge that displays the memory utilization for a distributed SAS LASR Analytic Server. You can also sign out of SAS Visual Analytics. |
| 3 | The navigation pane displays a tree (the SAS Folders tree) of tables and data queries. |
| 4 | The center of the screen contains the workspace. When you create a new object, such as a data query, it is represented as a tab on the top of the workspace.
The bottom of the workspace contains a series of tabs that enable you to create column
expressions, joins, and
filter data.
|
| 5 | The right pane enables you to manage the properties of the item that is selected in the workspace. |
| 6 | The toolbar contains icons that enable you to manage, run, and schedule data queries. |
Copyright © SAS Institute Inc. All Rights Reserved.
Last updated: January 8, 2019