Example: Data-Driven Lattice
About the Data-Driven Lattice Example
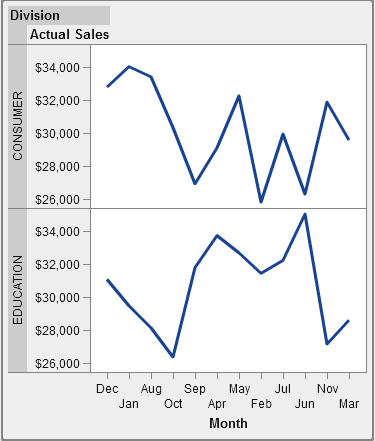
This example shows the sales for a line of retail products over a period of time.
The custom graph object specifies a row-based lattice in which the rows correspond to the corporate divisions that are responsible for
the sales. The corporation has two divisions, resulting in a graph with two rows.
Example Data-Driven Lattice
Build the Graph Object for the Data-Driven Lattice Example
-
-
On the Role Definitions tab, click
 next to Category, and select Edit
Role. The Edit Role window is
displayed.
next to Category, and select Edit
Role. The Edit Role window is
displayed.
-
Select Datetime for Classification.Click OK.Specifying Datetime forces the report designer to assign date and time data to the Category role.
-
Specify the role to which a class variable is assigned.
-
In the Data-Driven Lattice section on the Role Definitions tab, click Add Lattice Role. The Add Role window is displayed.
-
Select Row for Role Type.
-
Select Category for Classification.
-
Select Required. With this option selected, the report designer must assign data to this role to render the report with data assigned.
-
Click OK.
-
-
Save the graph object. See Save a Custom Graph Object So It Appears in the Designer.
Copyright © SAS Institute Inc. All Rights Reserved.
Last updated: January 8, 2019