Your First Look at the Designer
When you are designing
reports in SAS Visual Analytics, you see the designer. In general,
data-related tasks are initiated from the leftmost pane, and presentation-related
tasks are initiated from the rightmost pane.
Here are the features
of the designer:
The Designer
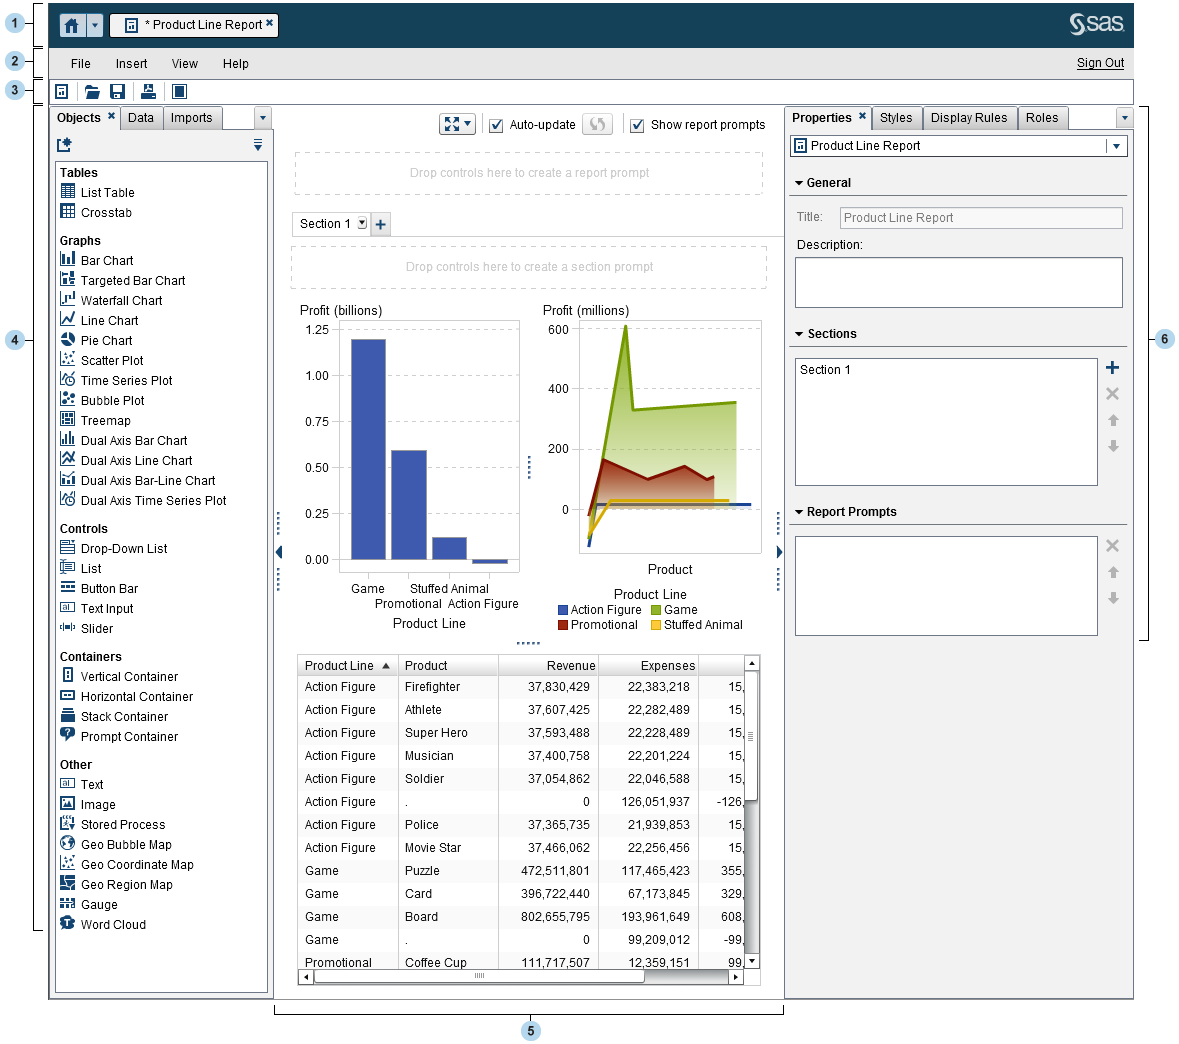
| 1 | The application bar enables you to return to the home page and to access other parts of SAS Visual Analytics and other SAS applications that integrate with the home page. You can access your recently created or viewed reports, explorations, stored processes, data queries, or other objects in your recent history. Buttons are displayed for each open application. |
| 2 | The menu bar provides menu items that apply to the entire report or to the currently displayed report section. Actions include creating a new report, adding a new section, inserting new report objects, adding interactions, and launching the viewer without returning to the home page. You can also sign out of SAS Visual Analytics. |
| 3 | The toolbar contains icons that enable you to manage and print your reports. You can click  to hide the left and right panes. Or, you can click to hide the left and right panes. Or, you can click  to display the left and right panes. to display the left and right panes.
|
| 4 | The tabs in the left pane enable you to work with new report objects, data, imported report objects, and shared rules. |
| 5 | The canvas is the workspace for building a report. The appearance of the canvas is affected by the report theme. |
| 6 | The tabs in the right pane enable you to work with details about the report and report objects. |
Copyright © SAS Institute Inc. All Rights Reserved.
Last updated: January 8, 2019