Add a New Rank
You can use the Ranks tab to create ranks to subset the data in your reports. You can also right-click on your graphs and tables to add a rank to limit the number of bars, rows, and so on. Controls and gauges support ranks.
A single category rank ranks the top of a single category.
To add a rank:
-
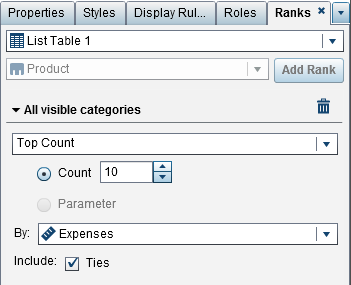
Click the Ranks tab.
-
Select a data item. You can select any category or geography data item, regardless of whether it is assigned to the current report object.For list tables only, you can select All visible categories. This rank ranks across the intersection. The top or bottom combination of the visible categories is displayed. For example, you select the region and product data items. You rank on the top 10 by profit. The top 10 region and product combinations are displayed. In this case, the column is no longer considered a single column, it is considered the crossing of the columns.Note: If a list table has a rank for All visible categories, then that is the only rank that it can have.The Detail rank option is available for list tables, bubble plots, and scatter plots that show detail data. If the report object has a detail rank, then it is the only rank that it can have. Otherwise, report objects can have multiple ranks.
-
Click Add Rank. The Ranks tab expands.
-
Select the type of rank from the drop-down list. These types are available:
-
Top Count specifies that the rank selects the greatest values.
-
Bottom Count specifies that the rank selects the least values.
-
Top Percent specifies that the rank selects the greatest percentages.
-
Bottom Percent specifies that the rank selects the least percentages.
-
-
If you selected Top Count or Bottom Count for the rank, then specify one of the following:
-
Select Count, and then select a number for the rank. For example, if you select
5, then the rank selects the five greatest values. -
Select a Parameter. If there is more than one parameter available, use the drop-down list to select the one that you want. For more information, see Working with Parameters in Reports.
-
-
If you selected Top Percent or Bottom Percent for the rank, then specify one of the following:
-
Select Percent, and then enter a number between 0.1 and 99.9 in the % field.
-
Select a Parameter. If there is more than one parameter available, use the drop-down list to select the one that you want. For more information, see Working with Parameters in Reports.
-
-
From the By drop-down list, select the measure that is used to create the rank. You can select any measure.
-
(Optional) Select Ties to include ties in the rank.If you select Ties, then the rank selects as many values as necessary to include all of the ties. If you do not select Ties, then the rank selects only the number of values that are specified by the rank parameters.For example, if your rank selects the top three values, but there are five values tied for the greatest value, then the number of values that are selected by the rank depends on the Ties option. If you select Ties, then the rank includes all five of the tied values. If you do not select Ties, then the rank includes only three of the tied values.
-
(Optional) For category-specific ranks, you can select All Other to show the measurements for the categories that did not qualify as a top or bottom value. This option is not available if the report object is showing only detail values.Here are some key points about the All Other option:
-
The option is available when you are ranking visible categories in certain types of report objects.
-
The option applies only to the category that is being ranked. For example, suppose that you have Region and Product categories assigned to a list table. Then, you apply a Region rank with the All Other option set, so the “All Other” value might appear as a Region value, but not as a Product value.If you want to combine category values that are excluded by rank into “All Other”, then you need to use the All Other property. For more information, see Use the Combine Excluded Rows (or Cells) into “All Other” Properties.
-
The option is not available if the rank is on a prompt control, geo bubble map, geo coordinate map, or geo region map.
-
When the option is specified for a report object, the total, subtotal, and percent of total show values with respect to all of the data, rather than data just relative to data qualifying under the rank. The data that does not fit into the top or bottom of the rank is aggregated in the All Other category.
-
If this option is selected, then any All Other value that appears in a table or graph cannot be selected. This means that the All Other value cannot be the source value for an interaction.
-
If you do not select All Other, then the rank shows only the data as filtered by the category values that qualify as the top or bottom value.
-
By default, your new rank is applied automatically to the report object.
You can add more than one rank to a report object, as long as the first rank is not
a Detail rank, or an All visible categories rank.
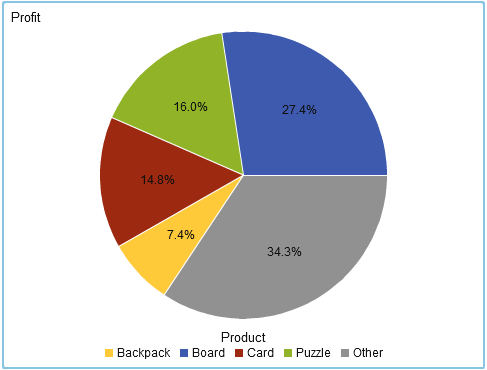
Here is an example
of a pie chart that shows the profit for multiple product lines before
a rank is applied:
Pie Chart with Profits for Each Product Line Displayed
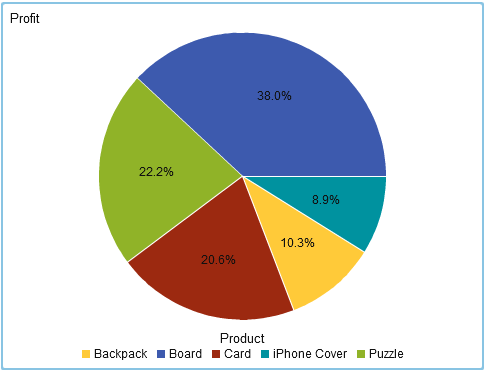
Here is the same pie
chart after a rank of the top five product lines is added. The All
Other option was selected, so the “Other”
slice is not displayed.
Pie Chart with Profits for the Top Five Product Lines Displayed
Copyright © SAS Institute Inc. All Rights Reserved.
Last updated: January 8, 2019