Working with the Fit Summary Window
About the Fit Summary Window
The Fit Summary plots the relative importance of each variable as measured by its p-value.
The p-value is plotted on a log scale and the alpha value (plotted as -log(alpha)), is shown as a vertical line. To adjust
the alpha value, click, drag, and drop the vertical line. A histogram of the p-values
is displayed at the bottom of the window.
Including a Group By Variable
When your analysis
includes a group by variable, the Fit Summary displays a Goodness
of Fit plot and Variable Importance plot.
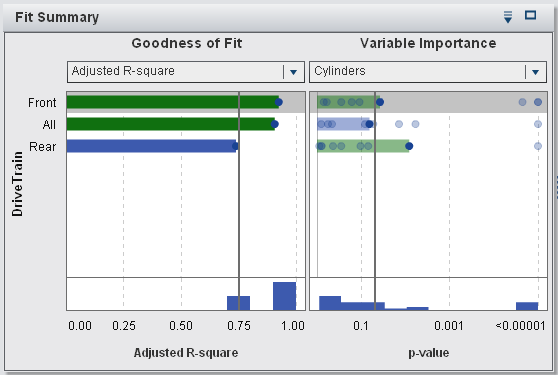
The Variable
Importance plot enables you to select a single variable to inspect within each level of the group by variable. Use the drop-down menu to select which variable you want to inspect. Each dot in the Variable
Importance plot represents a model effect. The bars are drawn for the effect selected in the drop-down menu.
The Goodness
of Fit plot, which is not available when there is no group by variable, displays how well
the model predicts the response variable within each level of the group by variable. Use this plot to determine whether your
model has a significantly different fit within different levels.
Notice that when you select a group by variable, the Residual Plot, Assessment,
and Influence Plot are updated. These plots enable you to further inspect the variable within each
level of the group by variable.
Use  to specify how the plots are sorted.
to specify how the plots are sorted.
Copyright © SAS Institute Inc. All Rights Reserved.