Creating a Report Interaction
Create a Filter Interaction
You can create interactions
using the interactions view or the Interactions tab
in the right pane.
The following objects that are imported from the explorer can be the source of a filter interaction:
-
Box plots
-
Heat maps with a relational category measure
-
Forecast plots
-
Geo maps
Imported correlation matrices, histograms, scatter plots with fit lines, heat maps without a selectable relational category measure, and box plots without a selectable relational category measure cannot be the source of an interaction.
Hierarchy data items are not supported for interactions.
Here are some key points about creating filter interactions:
-
You cannot create interactions from list tables, bubble plots, and scatter plots that use detail data. However, a list table that uses detail data can be the target of an interaction.
-
Scatter plots cannot be the source of an interaction.
-
Bubble plots can be the source of an interaction only if they have a Grouping role assigned.
-
Sliders can be the target of an interaction. However, a slider that has the Set fixed range property set will not do anything when it is filtered because its data is fixed.
-
Prompt containers enable you to delay the execution of interactions to report objects that are outside of the prompt container. However, interactions between report objects that are inside a prompt container are never delayed.
To create a filter
interaction using the interactions view:
-
Add the report objects that you want to use to the canvas. For example, you might have a bar chart, a line chart, and a list table.
-
Click Interactions View on the Interactions tab to switch to the interactions view. You can also select View
 Show Interactions.
-
In the interactions view, draw a connection between the source and target report objects. When you have created an interaction, the
 is displayed between the report objects. Here is an example of an interaction between
a bar chart (the source) and a list table (the target):
Note: The source and target of an interaction should be based on the same data source. If you have multiple data sources, you are prompted to map the data sources to create the interaction. For more information, see Map Data Sources.
is displayed between the report objects. Here is an example of an interaction between
a bar chart (the source) and a list table (the target):
Note: The source and target of an interaction should be based on the same data source. If you have multiple data sources, you are prompted to map the data sources to create the interaction. For more information, see Map Data Sources.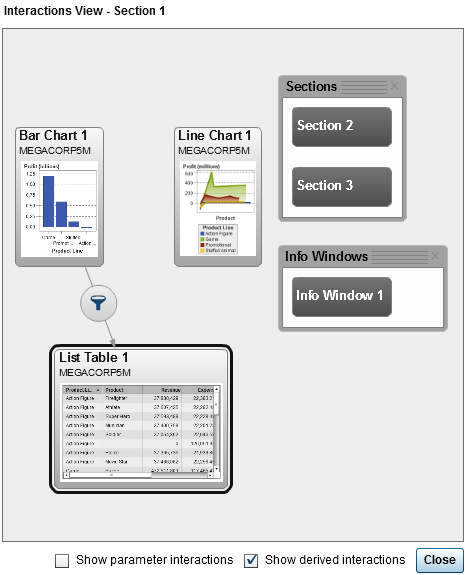
-
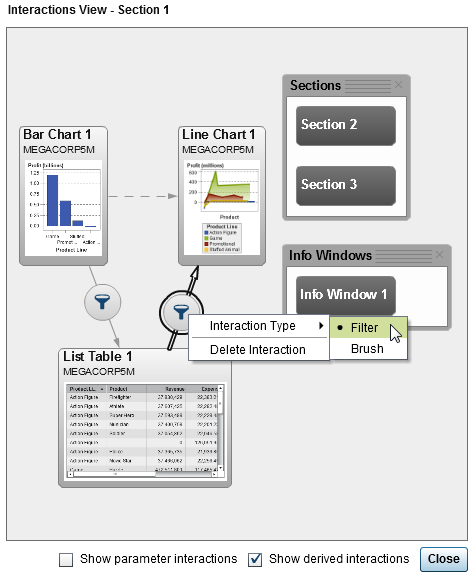
Right-click. Then, select Interaction
TypeFilter.
-
(Optional) Select the Show parameter interactions check box. (Parameter interactions are represented by dashed lines in the Interactions View. If the parameter is affecting a report object in another section, a link is drawn to that section. If a section contains a parameter that is targeting a report object in the current section, then a link is drawn from that section to the report object in the current section.)
-
(Optional) Clear the Show derived interactions check box. (Derived interactions are represented by dashed lines in the Interactions View.)
-
(Optional) Add other filter interactions.
-
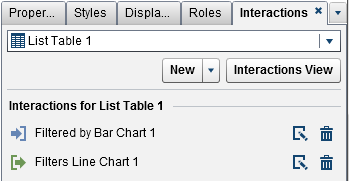
Click Close. The new interaction (or interactions) appears on the Interactions tab in the right pane.The following example shows the Interactions tab for the filtering example shown in A Filtering Example with a Bar Chart, a Line Chart, and a List Table.
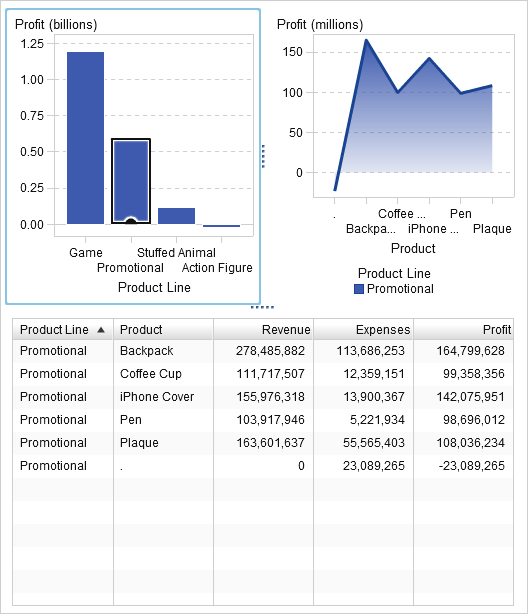
Select data in the
source report object to filter data in the target report object (or
objects). In the following example, the promotional product line was
selected in the bar chart. Simultaneously, the line chart and the
list table show the same filter.
A Filtering Example with a Bar Chart, a Line Chart, and a List
Table
Clicking on another selection applies the filter based on your new selection. For
example, in the report above, you can click on the game product line to change the filter. An icon is added to the report object that is filtered.
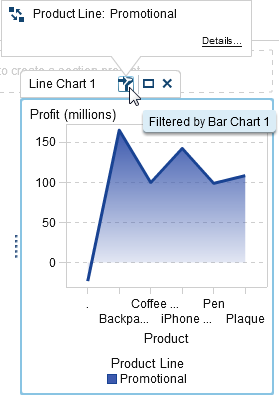
Here is the line chart
that was used in the previous example. The incoming filter icon appears
above the report object when it is selected in the canvas. Click  to get details about the filter that has been applied.
Click Details to find out more about the
filter. The Visual Element Filters window
is displayed. It shows the exact query that was sent to the server.
to get details about the filter that has been applied.
Click Details to find out more about the
filter. The Visual Element Filters window
is displayed. It shows the exact query that was sent to the server.
to get details about the filter that has been applied.
Click Details to find out more about the
filter. The Visual Element Filters window
is displayed. It shows the exact query that was sent to the server.
Tip
To clear the selection and
reset the filter (or filters), press Ctrl+click while viewing the
original report object.
To create an interaction
using the New button on the Interactions tab:
-
Select a report object in the canvas. For example, you might have a bar chart.
-
Select the Interactions tab.
-
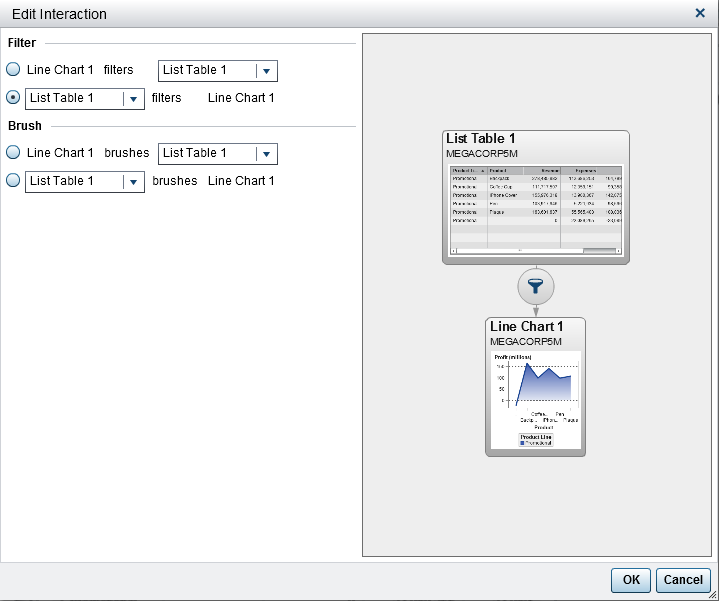
Click New, and then select Interaction. The Edit Interaction window is displayed.
-
In the Edit Interaction window, select the report object that you want to use as the source of a filter or brush interaction. For example, if your report has a list table, and you want it to filter a line chart, the first line should read List Table 1 filters Line Chart 1.The Edit Interaction window disables options for filter or brush interactions if they are not possible.
-
When you are finished working with interactions, click OK. The new interaction is displayed in the Interactions tab.
Create a Data Brushing Interaction
The following objects that are imported from the explorer cannot be the source of
a brush interaction:
-
Box plots
-
Heat maps with a relational category measure
-
Forecast plots
-
Geo maps
To create an interaction
using data brushing:
-
Add the report objects that you want to use to the canvas. For example, you might have a bar chart, a line chart, and a list table.
-
Select the Interactions tab.
-
Click Interactions View on the Interactions tab to switch to the interactions view. You can also select View Show Interactions.
-
In the interactions view, draw a connection between the source and target report objects. When you have created an interaction, the is displayed between the report objects.
Note: The source and target of a data brushing interaction should be based on the same data source. If you have multiple data sources, you are prompted to map the data sources to create the interaction. For more information, see Map Data Sources.
-
Right-click. Then, select Interaction
TypeBrush. The
filter icon changes to
 .
.
-
Click Close. The new interaction (or interactions) appears on the Interactions tab in the right pane.
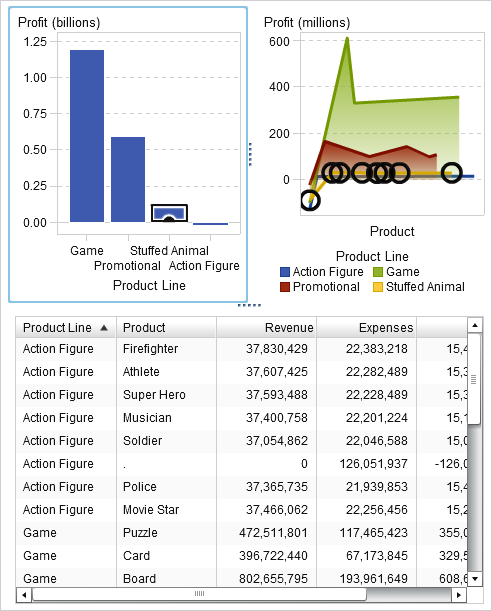
Select data in the source report object to brush data in the target report object (or objects). In the following example, the stuffed animal product line was selected
in the bar chart. Simultaneously, the line chart and the list table highlight the
same data.
A Data Brushing Example with a Bar Chart, a Line Chart, and
a List Table
Note: If a graph contains a frequency
measure, then a crosshatch pattern indicates when it is selected or
brushed.
The brush interaction between controls behaves differently than a brush interaction
between tables and
graphs. When there is a brush interaction between controls, instead of highlighting
or selecting the values in the other control, the values that match are moved to the
top of the control, and the values that do not match are grayed out. If a frequency
data item exists, then the frequency value is updated.
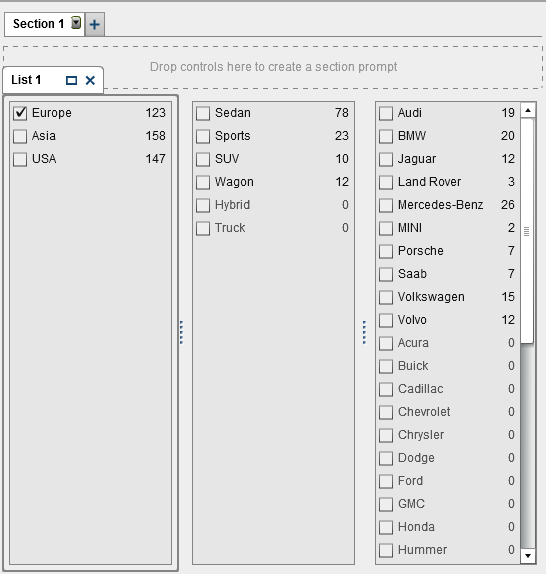
Here is an example
of a report with three list controls that have brush interactions:
Example: Three List Controls in a Report
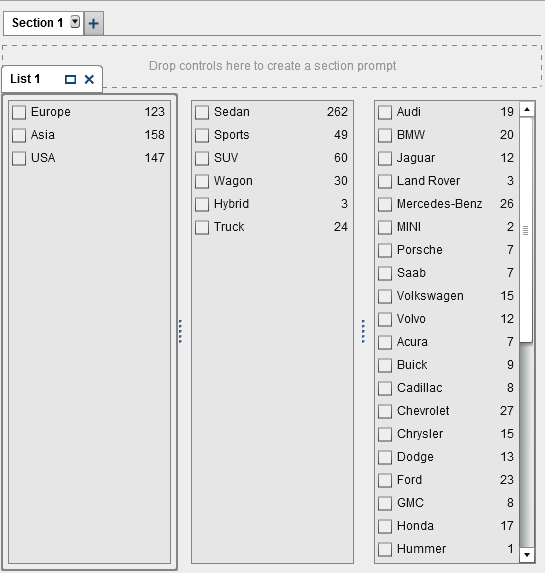
The first list contains
three countries listed as the Origin. The second list contains six types of vehicles. The third list contains 38 car manufacturing
companies. There is a brush interaction between the first list and the second list.
There is a second brush interaction between
the second list and the third list.
Here is an example
of the interactions view for the report:
Three List Controls with Brush Interactions
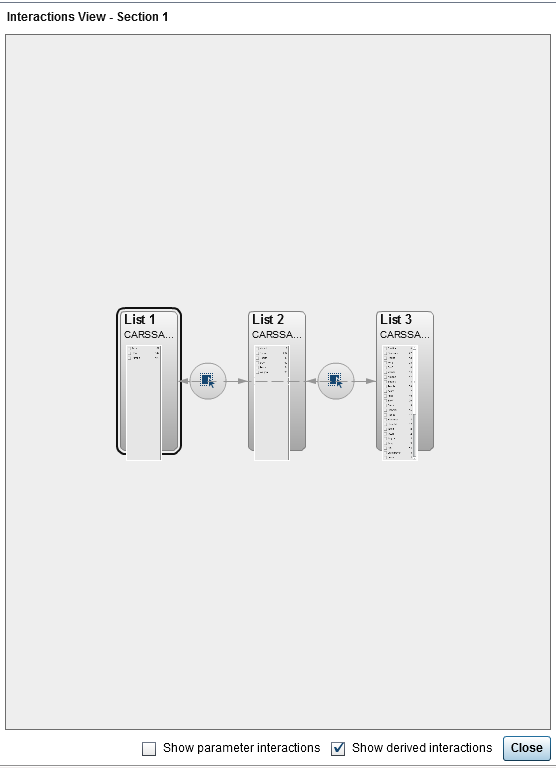
In step 1, the user
has selected Europe as
the country of Origin in
the first list. Notice the changes in the second list. Hybrid and Truck are
grayed out, and their frequency values have both changed to 0.
In the third list, all of the car manufacturers that are not located
in Europe are grayed out, and their frequency values have all changed
to 0.
Example: Three List Controls in a Report with One Brush Interaction
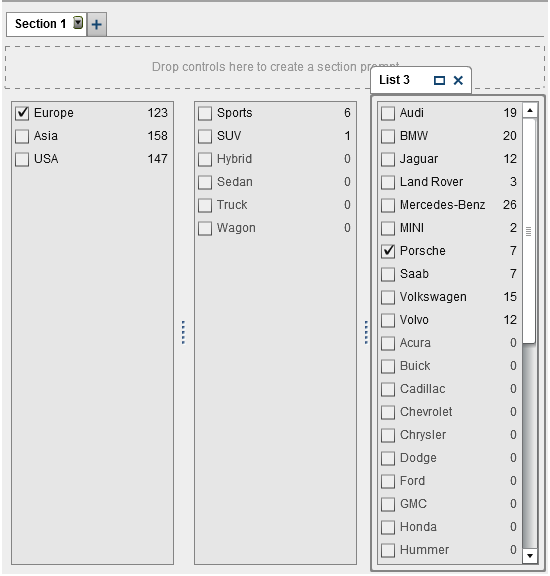
In step 2, the user
has selected Porsche as
the car manufacturing company in the third list. Notice the changes
in the second list. Hybrid, Sedan, Truck,
and Wagon are grayed out,
and their frequency values have all changed to 0.
Example: Three List Controls in a Report with Two Brush Interactions
Map Data Sources
The source and target of an interaction or link should be based on the same data source. You might be prompted to map data sources so that an interaction or link works properly in these situations:
-
When you try to create an interaction or link between a report object that uses one data source and another report object that uses a different data source.
-
When you try to create a link between a report object that uses one data source and a report section that uses a different data source.
-
When you try to create a link between a report object that uses one data source and a report that uses a different data source.
Here are some key points about mapping columns in data sources:
-
A column in one data source can be mapped only once to another data source. If you need to map a column more than once, then the column needs to be duplicated in the data source.
-
Mapped columns must share the same format for filters to work. For example, if the format of the source column is MMDDYYYY and the format of the target column is DDMMYYYY, then a filter will not work.
To map data sources
using the Map Data Sources window:
-
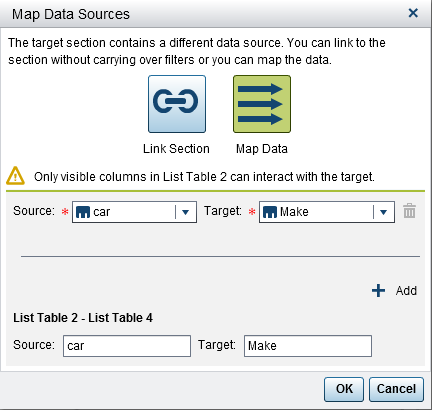
Use the Source drop-down list to select a column from the first data source.
-
Use the Target drop-down list to select a corresponding column from the second data source.Here is an example of the Map Data Sources window for an interaction between two list tables that have different data sources:
 TipIf there are multiple data sources, and you do not want to link to all of them, you can select the Enable data source mapping check box. For more information, see Map Data Sources.For section links, you are not required to map the data sources. If you choose not to map the data sources, then the filters are not carried over. For more information, see Create a Link to One or More Sections in a Report.Here is an example of the Create Section Link window with the map data sources information.
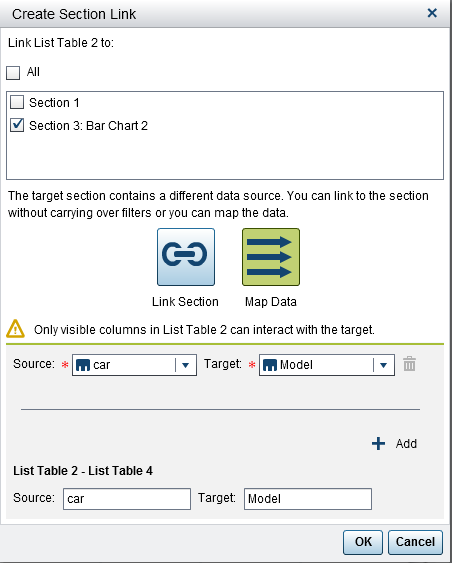
-
Map additional data items. Click
 . A new row is displayed in the Map Data
Sources window.
Note: If you create interactions between multiple objects on the same data source, but on different columns in that data source, then you must map each and every column in a Map Data Sources window. If you do not do this, then a subsequent mapping for the data source overrides a previous mapping.
. A new row is displayed in the Map Data
Sources window.
Note: If you create interactions between multiple objects on the same data source, but on different columns in that data source, then you must map each and every column in a Map Data Sources window. If you do not do this, then a subsequent mapping for the data source overrides a previous mapping. -
The lower half of the window shows you how the mappings are applied to the objects shown in the Source and Target relationship. Depending on the interaction or link, you might need to map additional Source and Target objects.
-
Click OK.
Copyright © SAS Institute Inc. All Rights Reserved.