Group By Variables
A group by variable enables you to fit a model for each data segment defined by one or more category variables. Each unique combination of levels across all of the group by variables is a specific
data segment. For example, if you have one group by variable with three levels, then
there are three data segments. But, if you have two group by variables, one with three levels and the other with
four levels, then there are at most 12 data segments. A data segment is not created
when there are no observations in a combination of classification levels.
SAS Visual Statistics enforces a maximum number of BY groups, except when you use the Advanced
Group By feature. By default, the maximum number of BY groups allowed is 1024. Empty data
segments count against the maximum number of BY groups allowed in a model.
When you specify two or more group by variables, the results are grouped in the order
in which the variables appear in
the Group By field.
In the Fit
Summary window, when you select a specific data segment, the Residual Plot and Influence
Plot windows are updated to include only the observations in the specified data segment.
The Advanced
Group By window provides more control over variable grouping.
To access the Advanced Group By window, click Advanced next
to Group By in the right pane.
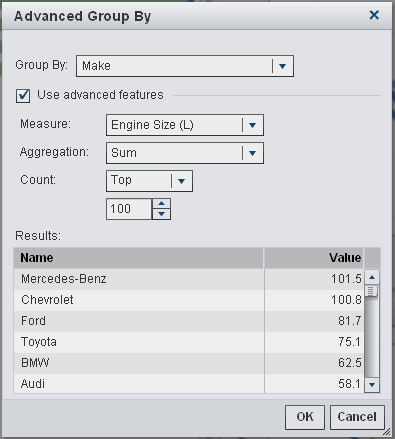
The Group
By field enables you to select the variable that is used
for grouping. Select the Use advanced features option to display aggregation statistics for a specified measure variable. Specify the measure variable in the Measure field.
The Aggregation field specifies whether the Average or Sum is
computed. Use the Count field to specify
whether you want the Top or Bottom n values.
The field below Count enables you to specify
the value of n.
Copyright © SAS Institute Inc. All Rights Reserved.