Select Components and Elements of a Graph Object
To change the properties of a graph element such as a bar chart, you must first select the graph element. Similarly, to change the properties of
a legend or an axis, you must first select the component.
When you select a component in a graph object, the selected component is highlighted.
The component is also displayed in the drop-down list at the top of the Properties tab. The available
properties vary depending on the selected component.
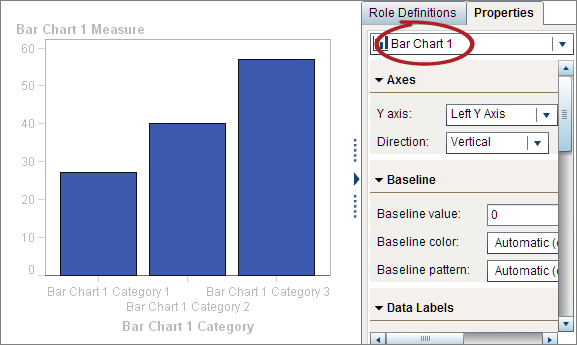
The following display shows a highlighted bar chart. The Properties tab
displays the properties for the bar chart, which is identified as Bar
Chart 1.
Tip
You can click  beside the drop-down list on the Properties
tab, and then select the component that you want to modify.
beside the drop-down list on the Properties
tab, and then select the component that you want to modify.
Here are some suggestions
for selecting graph elements:
-
-
To select the entire graph object, click above the graph element or cell area.
-
To select a cell in a multi-cell graph object, click the background area just above the graph element. The cell is highlighted, and a tab appears in the upper left corner of the cell. From the cell’s tab, you can delete and reorder graph elements. You can move graph elements to other cells.
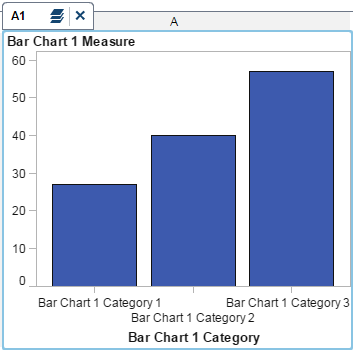
In a multi-cell graph object, cells are identified by a combination of a letter and
a number, such as A1,
B1, A2, and so on. The letters identify columns and the numbers identify rows. The
following table represents the labeling for a multi-cell graph object that contains
three columns and three rows:
|
A1
|
B1
|
C1
|
|
A2
|
B2
|
C2
|
|
A3
|
B3
|
C3
|
Copyright © SAS Institute Inc. All Rights Reserved.