Example: Vector Plot
About the Vector Plot Example
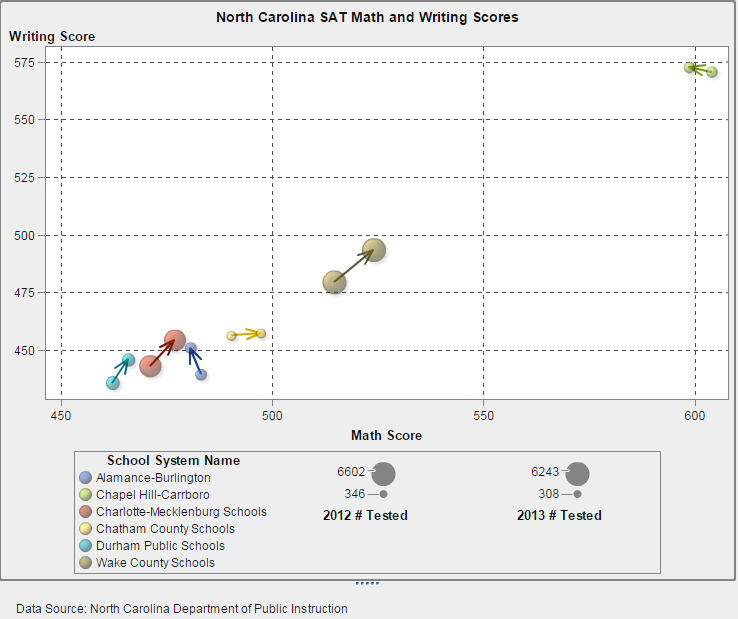
This example uses a vector plot to show the changes in SAT exam scores for different North Carolina school systems
from 2012 to 2013. The graph is enhanced by adding bubble plot overlays.
Here are the main features
of this graph:
-
Vector lines show the changes in the average math and writing scores between 2012 and 2013.
-
Bubbles represent the average score for each year. The size of the bubble represents the number of students who took the test.
-
To modify the appearance, the arrow line thickness was reduced and the transparency for the bubbles was increased. In addition, grid lines and a sheen data skin were applied to the graph. (These changes were made in the designer.)
-
To reduce the number of school systems for comparison, a filter was applied in the designer on the School System Name category.
Example Vector Plot with Bubble Plots
Build the Graph Object for the Vector Plot Example
Tip
As a shortcut, you can select
a bubble change plot from the graph gallery.
-
In the graph builder, drag and drop a vector plot from the Graph Elements pane onto the canvas.
-
Drag and drop a bubble plot from the Graph Elements pane onto the vector plot.
-
Drag and drop a second bubble plot from the Graph Elements pane onto the vector plot.
-
On the Role Definitions tab, share the roles. This action joins the vector origin point to the first bubble, and the vector termination point to the second bubble.
-
Click
 next to the Bubble Plot 1 X role.
Select Create Shared Role With Another Role
next to the Bubble Plot 1 X role.
Select Create Shared Role With Another Role Vector Plot 1 X Origin.
-
Click next to the Bubble Plot 1 Y role.
Select Create Shared Role With Another RoleVector Plot 1 Y Origin.
In the Add Shared Role window, specify Ystart as the name of the shared role. Click OK.
-
Click next to the Bubble Plot 2 X role.
Select Create Shared Role With Another RoleVector Plot 1 X.
In the Add Shared Role window, specify Xend as the name of the shared role. Click OK.
-
Click next to the Bubble Plot 2 Y role.
Select Create Shared Role With Another RoleVector Plot 1 Y.
In the Add Shared Role window, specify Yend as the name of the shared role. Click OK.
-
-
On the Role Definitions tab, add a group role to all three plots.
-
In the Bubble Plot 1 section, click Add Role. The Add Role window is displayed. The Group type is selected by default.Click OK.
-
Repeat the previous step for the Bubble Plot 2 section.
-
In the Vector Plot 1 section, click Add Role. The Add Role window is displayed.Select Group for the type of role. Click OK.
-
-
Share the Group role among all three plots.
-
In the Bubble Plot 1 section, click next to the Group role.
Select Create Shared Role With Another RoleBubble Plot 2 Group.
In the Add Shared Role window, specify Color as the name of the shared role. Click OK.
-
In the Vector Plot 1 section, click next to the Group role.
Select Use Shared RoleColor.
-
-
Specify that the plots start with the same color.
-
On the Properties tab, select A1 (the cell).
-
Click next to Overlaid plot colors,
and select All graphs start with the same color.
-
-
Remove redundancy from the legend.
-
On the Properties tab, select the Discrete Legend.
-
-
-
Specify the bubble size. This is an optional change made only to improve the appearance of the bubble sizes with respect to the vector lines.
-
On the Properties tab, select Bubble Plot 1.
-
Next to Radius of smallest bubble (pixels), enter the number 5.
-
Next to Radius of largest bubble (pixels), enter the number 12.
-
Repeat the previous steps for Bubble Plot 2.
-
-
Save the graph object. See Save a Custom Graph Object So It Appears in the Designer.
Copyright © SAS Institute Inc. All Rights Reserved.